10 Charts to Watch in 2023 [Q1 Update]
The key macro/market charts for navigating risk vs opportunity this year...
Here’s an update to the 10 Charts to Watch in 2023 as we head into quarter-end.
In the original article I shared what I thought would be the 10 most important charts to watch for global multi-asset investors in the year ahead (and beyond). In this article I have updated those 10 charts, and provided some updated comments.
[Note: I have included the original comments from back at the start of the year, so you can quickly compare what I'm thinking now vs what I said back then]
n.b. be sure to check out our [FREE] Chart Of The Week series for updates on all things macro & markets through out what could be another very interesting year!
1. Global Recession 2023: All leading indicators continue to point to recession, and there has been nothing to negate or confound that signal. If anything, the banking crises only raise the prospect and proximity of a steep global economic recession.
“One of the most interesting pieces of work I undertook in 2022 was to perform a sort of meta-analysis on all the leading indicators I’ve developed over the years. The key takeaway from that is whether you group leading indicators by type/factor, geography, or forecast window — they are all unanimous in pointing to a sharp downturn heading into early-2023. In many ways it’s a coming full circle of the massive stimulus that was unleashed in 2020. Or as I call it: “a strange but familiar cycle”.”
2. Double Trouble: Indeed, a key implication of the banking crisis — AND the fact that central banks have continued hiking rates undeterred — is that the “dual tightening“ of rising interest rates and tighter lending standards has only intensified. It’s hard to borrow and it’s hard to be a borrower in this environment.
“I include this one because it goes to show how financing conditions have tightened — banks are becoming more stringent and stingy in their lending decisions, and the interest rate on those loans is now a lot higher. So it's a situation of even if you can get a loan, you might not be able to afford it! If we do get a recession this year it could be the last straw for some of the more unsustainable business models that arose in the world of zero interest rates, and credit stress could become a key issue.”
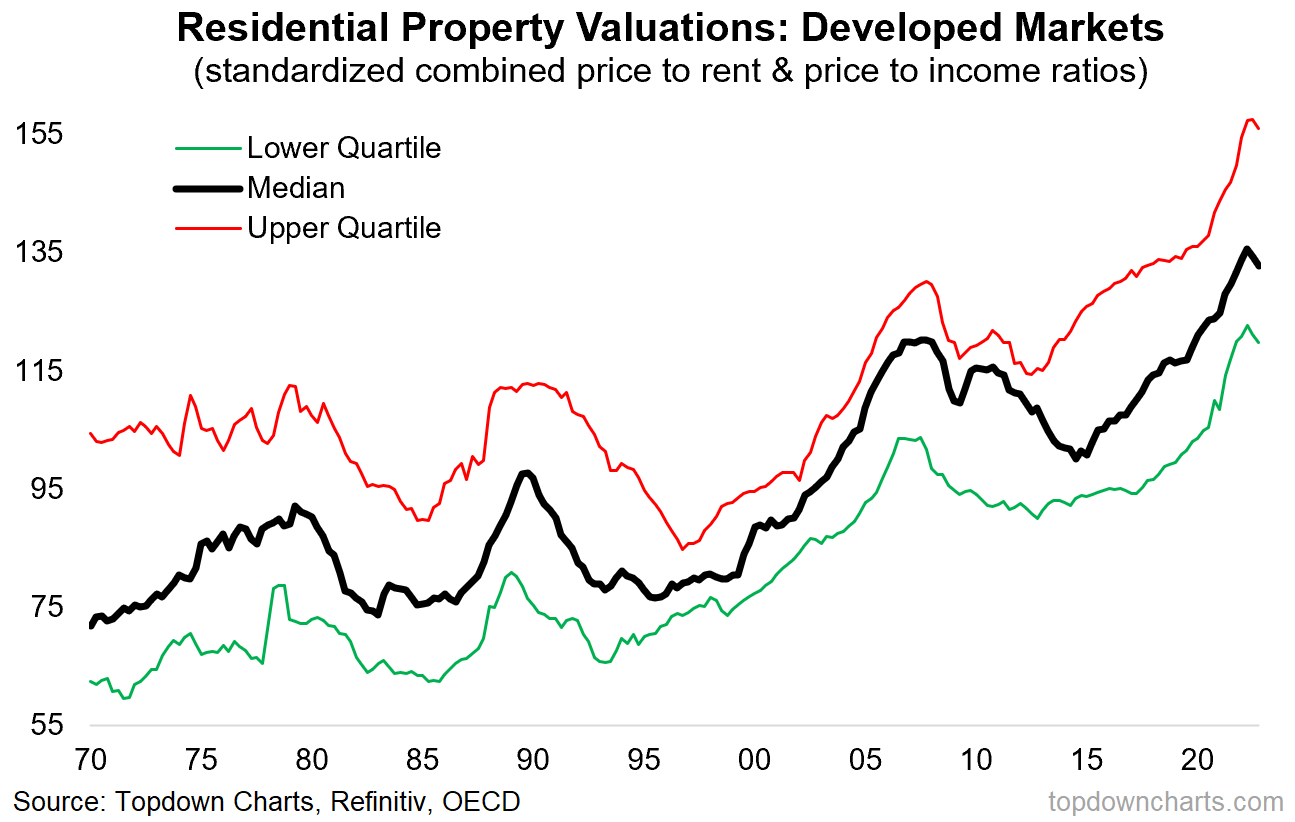
3. Property At Risk: A key risk from recession prospects, rising interest rates, and credit tightening is that extreme overvaluation in real estate gets corrected. Residential and especially commercial real estate need to be closely monitored due to the risk of downward spirals and self-reinforcing crisis feedback loops.
“Housing market valuations reached a record high across developed markets last year. That’s going to be a problem if rates stay high or head higher (and if real incomes continue to squeeze). Key risk to monitor.”
4. Unflation: Perhaps one bright side of the downside is that weaker growth will lead to further freeing up of capacity and hence dampen underlying inflation pressures. Albeit some might argue that this kind of triumph over inflation is the quintessential pyrrhic victory.
“The downward drift in commodity prices is already going to dampen headline inflation, but a recession will seal the deal (the fastest way to free up tight capacity is demand destruction: central banks understand this).”
5. Bond Yield Go Down: Still open air between the level of US 10-year yields and the bond macro models. Bond markets remain focused on inflation risk and rate hikes — which is keeping yields high, but if/when growth risk comes into focus then yields could quickly and sharply drop to close the gap.
“Weaker growth, credit stress, housing market issues, lower inflation… it’s all a recipe for lower bond yields. If we take my macro models literally then US 10-year bond yields could head back below 2.0% (even as low as 1%?!) by the middle of this year. Sure, there’s a lot of if’s and but’s around that, but an interesting forecast being suggested by the data, and it fits with the macro (and valuations).”
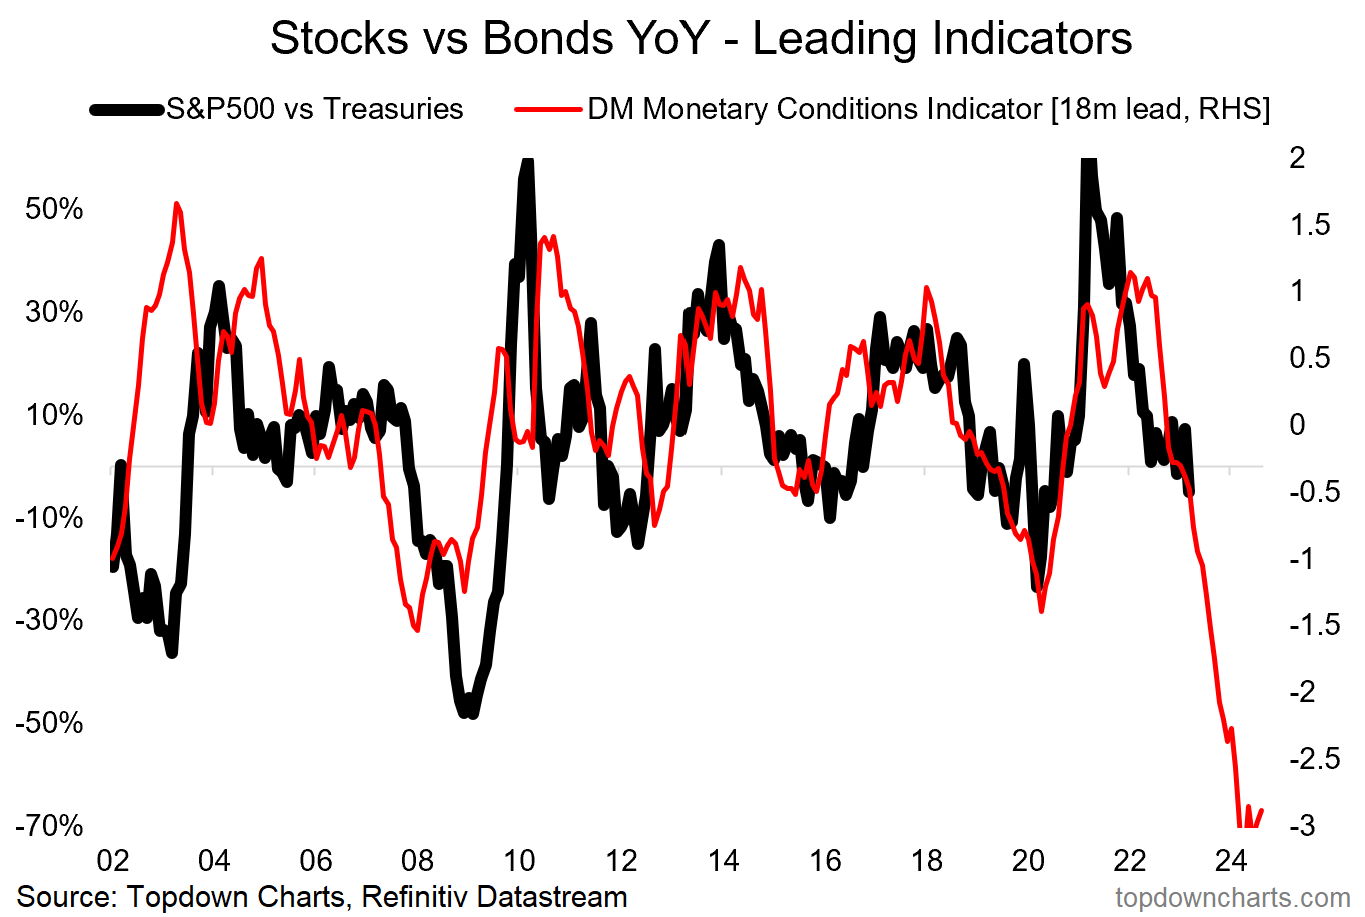
6. Bonds Beat Stocks: Logically, being bullish bonds and bearish on the economic outlook, this is the type of macro-market backdrop that favors bonds vs stocks and the leading indicator in the chart below suggests a significant shift in relative performance ahead.
“On valuations, treasuries are cheap, and stocks are not. By itself that means bonds have the advantage, but bonds also disproportionately benefit in the event that global recession does indeed set in. The leading indicator affirms this notion in the chart below.”
7. Monetary Risk to Macro Risk: Indeed, the key issue for equities at this point is a likely transition from monetary risk to macro risk. We know that the worst bear markets are those accompanied by recession (because of the impact on earnings and investor confidence). If recession is true then the bear market will be deeper and more prolonged.
“Arguably much of the pain in equities last year was down to the rates/inflation/monetary shock. Recession risk means slowing growth is set to become the bigger concern this year.”
8. Tech Unwind: Tech bubble 2.0 continues to run its course. The biggest test for the current popular narrative in growth/tech stock investing will be whether “bond yield go down = tech stock go up“ gets confounded by recessionary conditions impairing the cash flows that go into that equation. Still some ways to go here I think.
“Definitely different from the dot com bubble, but definitely also some excesses that needed to be unwound. My sense is we are still just over midway through this process, and ultimately: growth stocks can’t outgrow the macro.”
9. EM Stocks & Bonds: Amidst all the doom and gloom there are opportunities out there (and also, a good junction to note that these things go in cycles, so don’t confuse all this as the ramblings of a perma-bear, I am a perma-pragmatist: there is a time to be bearish and a time to be bullish and a time to just wait and watch and figure it out). Anyway, point is EM stocks + bonds still look cheap.
“When it comes to emerging markets, the equities are looking somewhat cheap, but what’s really interesting is where the bonds got to. There is what appears to be a major once-in-a-decade value setup for emerging market sovereign bonds (I am talking at the asset class level, equal-weighted). I think this could be one of those moments in time for asset allocation, but a few things do need to go right for this one to work.”
10. China Policy Map: And an important follow-on to that one is the point that China is reopening and we know well by now given the experience around the rest of the world that reopening restores economic activity. To add to that, we have seen further disinflation dynamics in China, and this continues to afford scope for further stimulus (China continues to zig while the rest of the world is zagging on policy).
“With China transitioning away from zero covid to zero cares about covid, the door is opening wider and wider for more forceful stimulus. The property market downturn, global growth risks, and clear disinflation trend makes for a classic and compelling case for monetary easing. Amid an otherwise gloomy outlook for 2023, this could be a key bright spot for macro and markets if they do step up stimulus. So keep an eye on China macro.”
Summary and Key Takeaways:
-All leading indicators point to recession in 2023
-As a result (and along with tighter funding conditions), credit stress and real estate market risks are likely to become/remain a hot topic this year
-Weaker growth likely leads to lower pricing pressures (maybe even deflation risk)
-All of this supports the idea that bonds rally; 10yr yields could move sharply lower
-For stocks it’s a situation of moving from the monetary/inflation risk of last year into macro risk this year, and stocks likely underperform vs bonds as bonds rally and stocks continue through the bear market process
-EM assets (stocks and sovereign bonds) look promising, but a few things need to go right, such as a peak in EM policy rates and extension of US dollar weakness
-Despite the mostly admittedly gloomy prognosis, there remains ample opportunities for active asset allocators as the cycle progresses and risk vs reward balance shifts
Overall: I would repeat my quip of this being a “strange but familiar cycle”, particularly in that a lot of the usual macro/asset allocation sign posts that we usually follow continue to work and are pointing fairly clearly to the next steps. Hence from an asset allocation standpoint I would be overweight defense (cash and government bonds) vs underweight growth assets (equities, commodities, credit) given how things sit at the moment.
—
Thanks for reading!
n.b. these charts were first featured in the 2022 End of Year Special Report — click through for the full report (free download)
Best regards
Callum Thomas
Head of Research and Founder of Topdown Charts
For more details on the service check out this recent post which highlights:
a. What you Get with the service;
b. the Performance of the service (results of ideas and TAA); and
c. What our Clients say about it.
SEE ALSO: Making the Most of Topdown Charts (video walkthrough of the paid reports and how to actually use and apply them to your investing)
Follow us on:
LinkedIn https://www.linkedin.com/company/topdown-charts
Twitter http://www.twitter.com/topdowncharts


Nice work
ICYMI: here's the original 10 Charts to Watch in 2023 post: https://topdowncharts.substack.com/p/the-10-charts-to-watch-in-2023