
Chart of the Week and Weekly Report Highlights
This week: value vs growth, covid case trends, global PMI pulse, inflation vs deflation, stocks vs bonds, fund flows and IPOs

This email provides a look at what we covered in the latest Weekly Insights report
The weekly insights report presents some of the key findings from our institutional research service, providing an entrée experience (in terms of price and size).
Chart of the Week - Everything is Expensive
Absolute Valuations — Stocks & Bonds: This chart shows absolute valuation indicators for stocks and bonds - and the punchline is: both are about 2 standard deviations expensive vs history.
This is highly unusual - usually it is one or the other, for instance compare and contrast the peak of the dot com bubble vs the trough of the global financial crisis. We are in uncharted territory right here.
It would be nearly unthinkable that both stocks and bonds could fall at the same time to the extent required to drive both of those valuation indicators back to their mean. But a heavy dose of inflation and or/policy tightening could be one thing to do that.
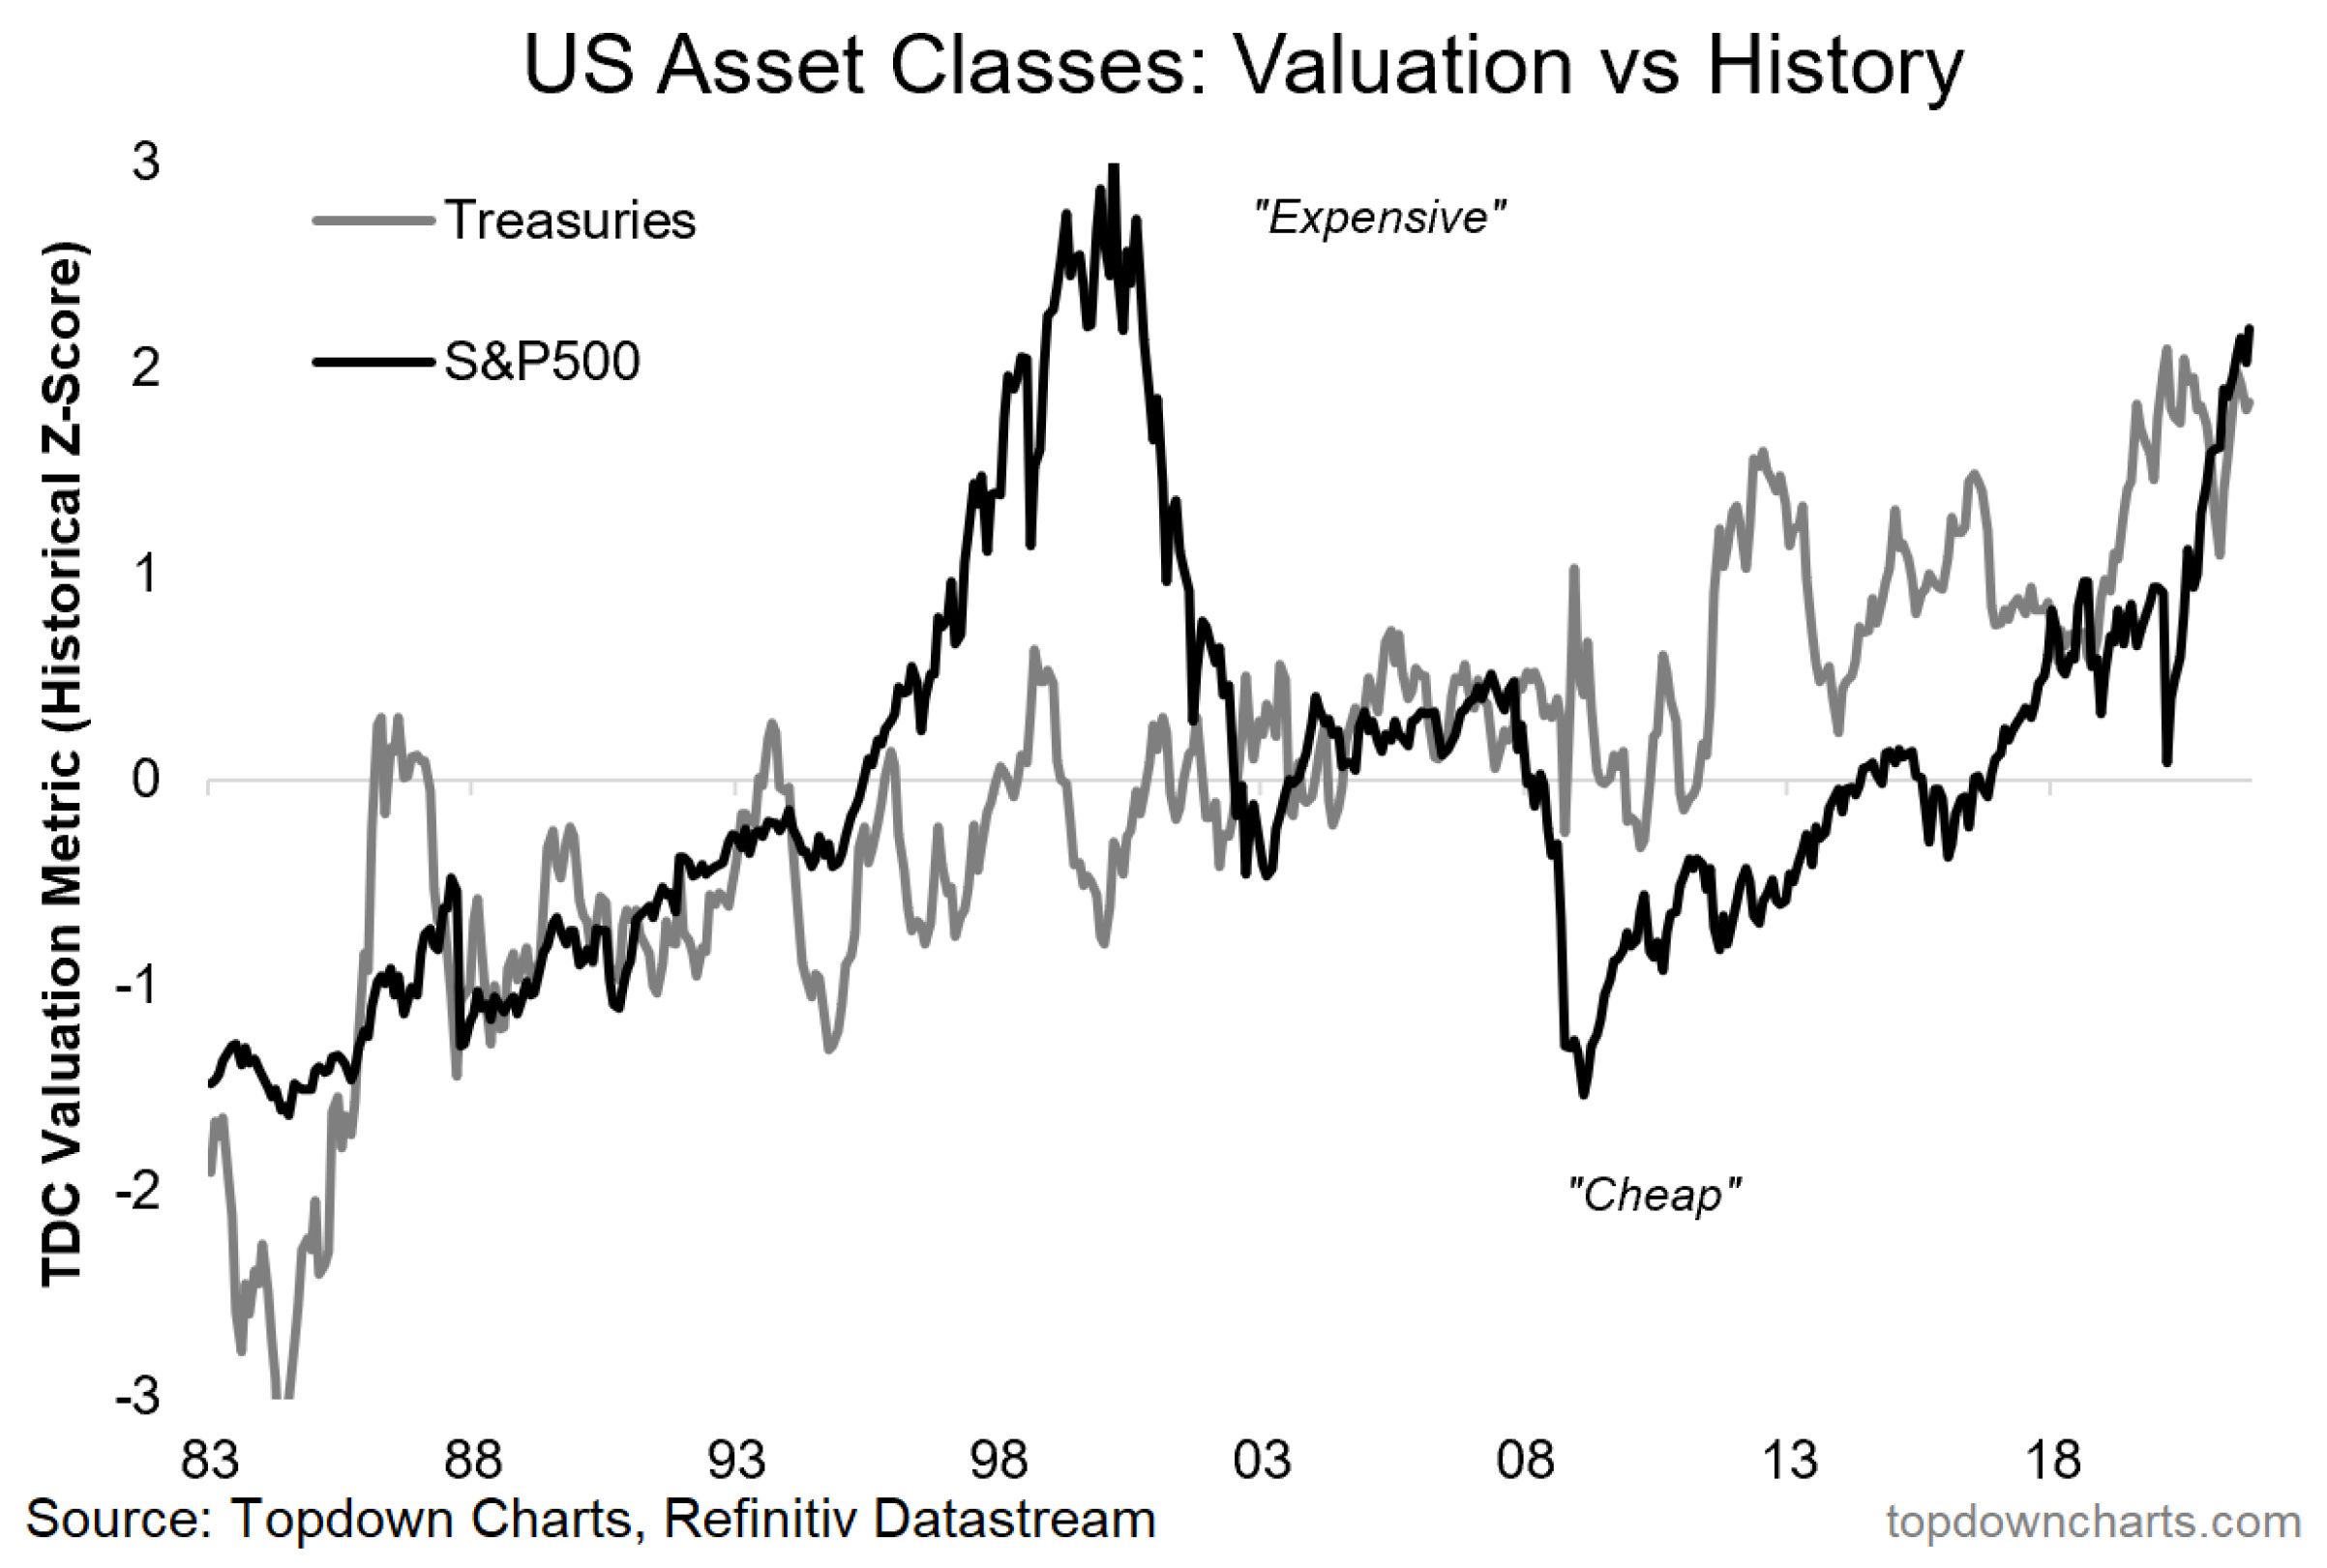
Key point: Both stocks and bonds are extremely expensive vs history.
If you haven’t already, be sure to subscribe to our paid service so that you can receive the full reports ongoing (along with access to the archives, monthly asset allocation review, and Q&A).
Topics covered in the latest Weekly Insights Report:
Covid Trends: cases are rising but deaths steady as vaccination rates rise.
PMI Pulse: global economic recovery is broadening out (but China).
Inflation vs Deflation: how pricing pressures may end up deflationary.
Stocks vs Bonds: mixed signals on the outlook for stocks vs bonds.
Funds, Flows, and IPOs: a survey of the state of speculation.
Value vs Growth: on-watch following an initial breakdown.
Emerging Markets: composite sentiment indicator continues to fall.
Subscribe now to get instant access to the report so you can check out the details around these themes, as well as gaining access to the full archive of reports.
Thanks for your interest. Feedback and thoughts welcome.
Sincerely,
Callum Thomas
Head of Research and Founder at Topdown Charts
Follow me on Twitter
Connect on LinkedIn