
Chart of the Week and Weekly Report Highlights
This week: commodities sentiment, EM Risk Watch, covid divergence, bond technicals, gold price outlook, silver sentiment, and TIPS

This email provides a look at what we covered in the latest Weekly Insights report
The weekly insights report presents some of the key findings from our institutional research service, providing an entrée experience (in terms of price and size).
Chart of the Week - Gold Getting Ready
Gold Market Technicals: Similar to the chart on treasuries (in the latest Weekly Insights report), gold market technicals are also high on the radar. Gold is likewise being compressed into a progressively tighter trading range.
One of my favorite market rules of thumb is that periods of low volatility (tighter trading ranges) often precede periods of higher volatility (breakouts and turning points)… and vice versa. In that respect, we need to keep a close eye on gold too.
Interestingly, the composite FX breadth indicator (tracking the price of gold against a basket of currencies) has been turning higher from a period of predominantly bearish momentum. I think that’s about as good a clue as any to be on watch for an upside breakout (but albeit open minded because when it does break out it could go in either direction, and which ever direction it goes will likely be an explosive move).
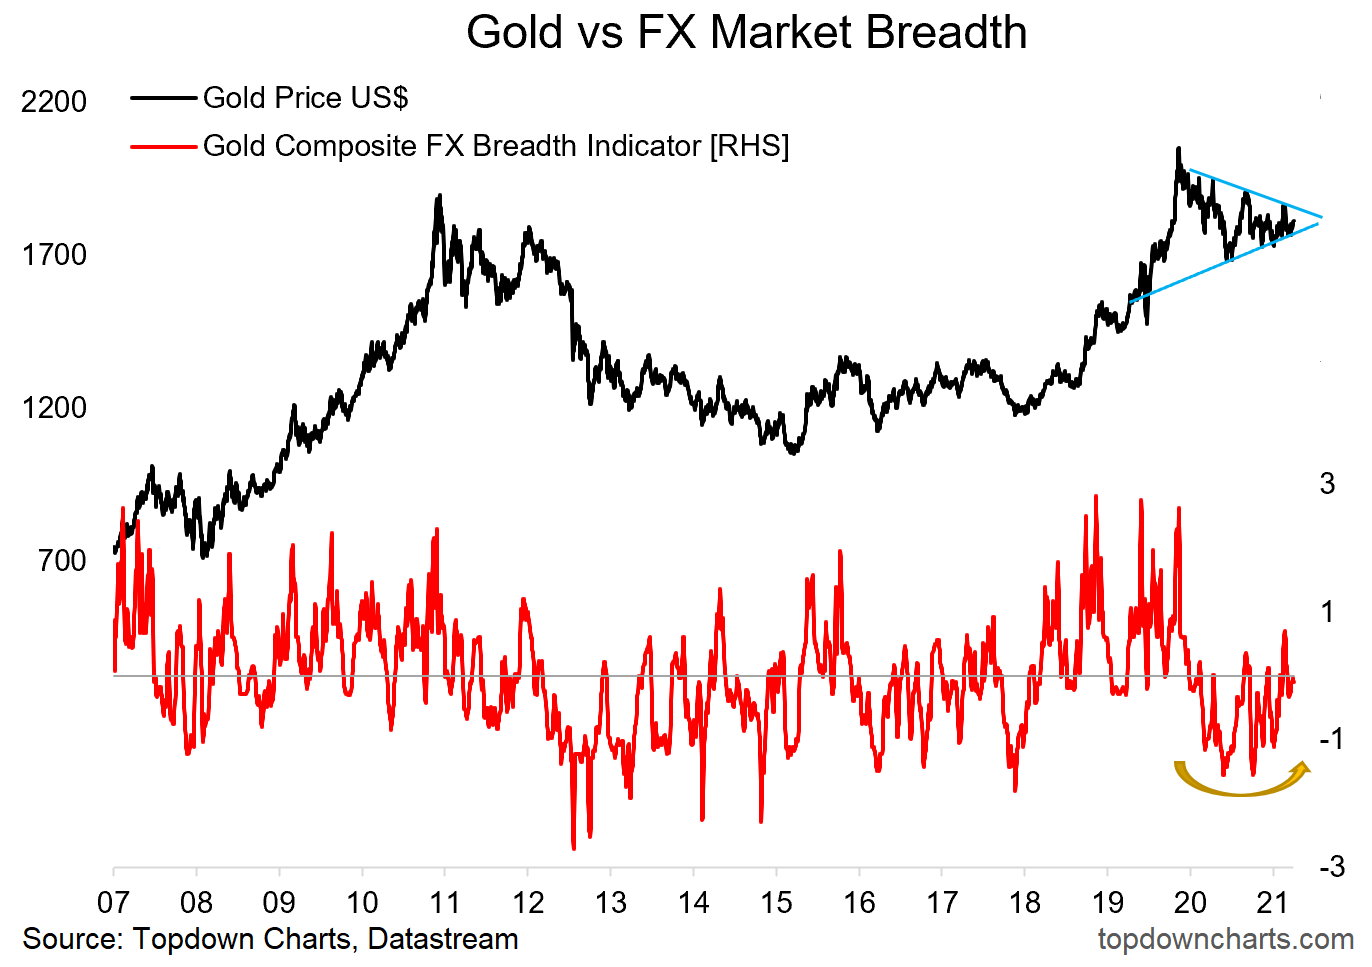
Key point: Gold looks to be setting up for a big move (perhaps up, given FX breadth).
If you haven’t already, be sure to subscribe to our paid service so that you can receive the full reports ongoing (along with access to the archives, monthly asset allocation review, and Q&A).
Topics covered in the latest Weekly Insights Report:
Commodities Sentiment: big reset in sentiment, clues on next steps.
EM Risk Watch: some promising signs, but also ongoing signs of weakness.
Global Covid Trends: a very interesting wedge opening up.
Bond Market Technicals: tighter and tighter in the trading range.
Silver Sentiment: big shift in sentiment, so what’s next?
TIPS and Inflation: low-key mind-blowing chart on TIPS ETFs.
Subscribe now to get instant access to the report so you can check out the details around these topics, as well as gaining access to the full archive of reports.
Thanks for your interest. Feedback and thoughts welcome.
Sincerely,
Callum Thomas
Head of Research and Founder at Topdown Charts
Follow me on Twitter
Connect on LinkedIn