


Chart of the Week and Weekly Report Highlights
This week: Leading Indicators, Global Equities Risk Review, Stock/Bond Ratio, Industrial Metals, Capital Market Assumptions, USD breakout, real yields, fund flows

This email provides a look at what we covered in the latest Weekly Insights report
The Weekly Insights Report is part of our entry-level service: presenting some of the key findings from our institutional research service — providing an entrée experience (in terms of price and size).
Chart of the Week - Global Equities ex-Growth
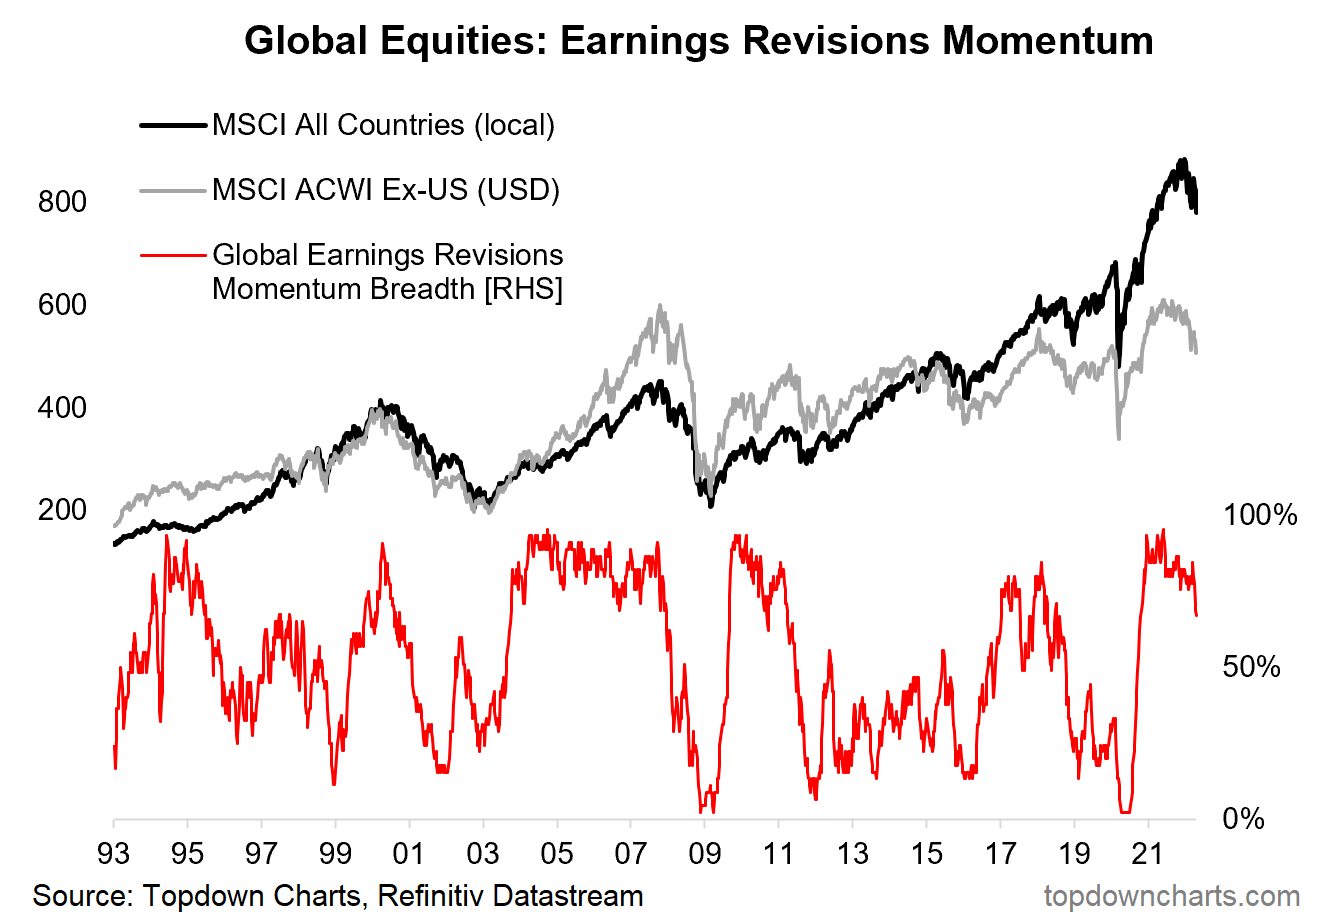
Global Earnings Revisions — Market Going “ex-Growth“? This chart shows the breadth of earnings revisions momentum (ratio of upgrades to downgrades and rate of change in forward earnings) across all the countries that the data is available for (using Refinitiv I/B/E/S data - the gold standard in analyst consensus earnings estimates). Basically it shows the pulse in earnings revisions at a global level.
The key point is across countries there is a clear loss in earnings momentum. There was the initial drop during the pandemic panic, followed by a massive surge thanks to stimulus and reopening. Pandemic winners e.g. tech, also saw a substantial one-off surge in earnings as the global wave of lockdowns and work-from-home triggered a mass-adoption of tech and sped up a number of existing trends.
But now those tailwinds have been and gone, and what’s worse: the past stimulus tailwinds are now turning to headwinds as central banks hike rates, bond yields surge, and cost pressures bite as an inflationary shock takes hold. And for earnings growth, we know the base comparator matters, and now the hurdle for achieving the same rate of growth has been set higher.
In many ways then the market is moving into a period of “ex-growth“, as those past boosters to earnings now come home to roost as long-term symptoms of the pandemic. You might say that earnings are set to suffer the effects of long covid! With that comes the end of the stimulus driven bull market.
Key point: Global equities risk further downside as the market goes ex-growth.
If you haven’t already, subscribe to our paid service so that you can receive the full reports ongoing (along with access to the archives, monthly asset allocation review, and Q&A). Also feel free to share this email with your friends/colleagues!
Topics covered in the latest Weekly Insights Report:
Leading Indicators: a growing consensus of indicators point to slowdown.
Global Equities Risk Review: deteriorating technicals, multiple headwinds.
Stock/Bond Ratio: where-to next for stock/bond relative performance.
Industrial Metals: increasingly complex as tailwind/headwinds meet.
Capital Market Assumptions [Update]: updated LT growth inputs.
Fund Flows: transitioning from “buy everything” back to “sell everything”.
US Dollar Breakout: a look at DXY technicals and outlook.
Real Yields: US 10yr TIPS real yields turning positive again.
Subscribe now to get instant access to the report so you can check out the details around these themes, as well as gaining access to the full archive of reports.
Thanks for your interest. Feedback and thoughts welcome.
Sincerely,
Callum Thomas
Head of Research and Founder at Topdown Charts
Follow me on Twitter
Connect on LinkedIn