Chart of the Week and Weekly Report Highlights
This week: Tech Wreck Check, Global Equity Technicals, Monetary headwinds, China Aye Shares, NZ Equities, Leveraged Equity Bets, Commodities, REITs.
This email provides a look at what we covered in the latest Weekly Insights report
The Weekly Insights Report is part of our entry-level service: presenting some of the key findings from our institutional research service.
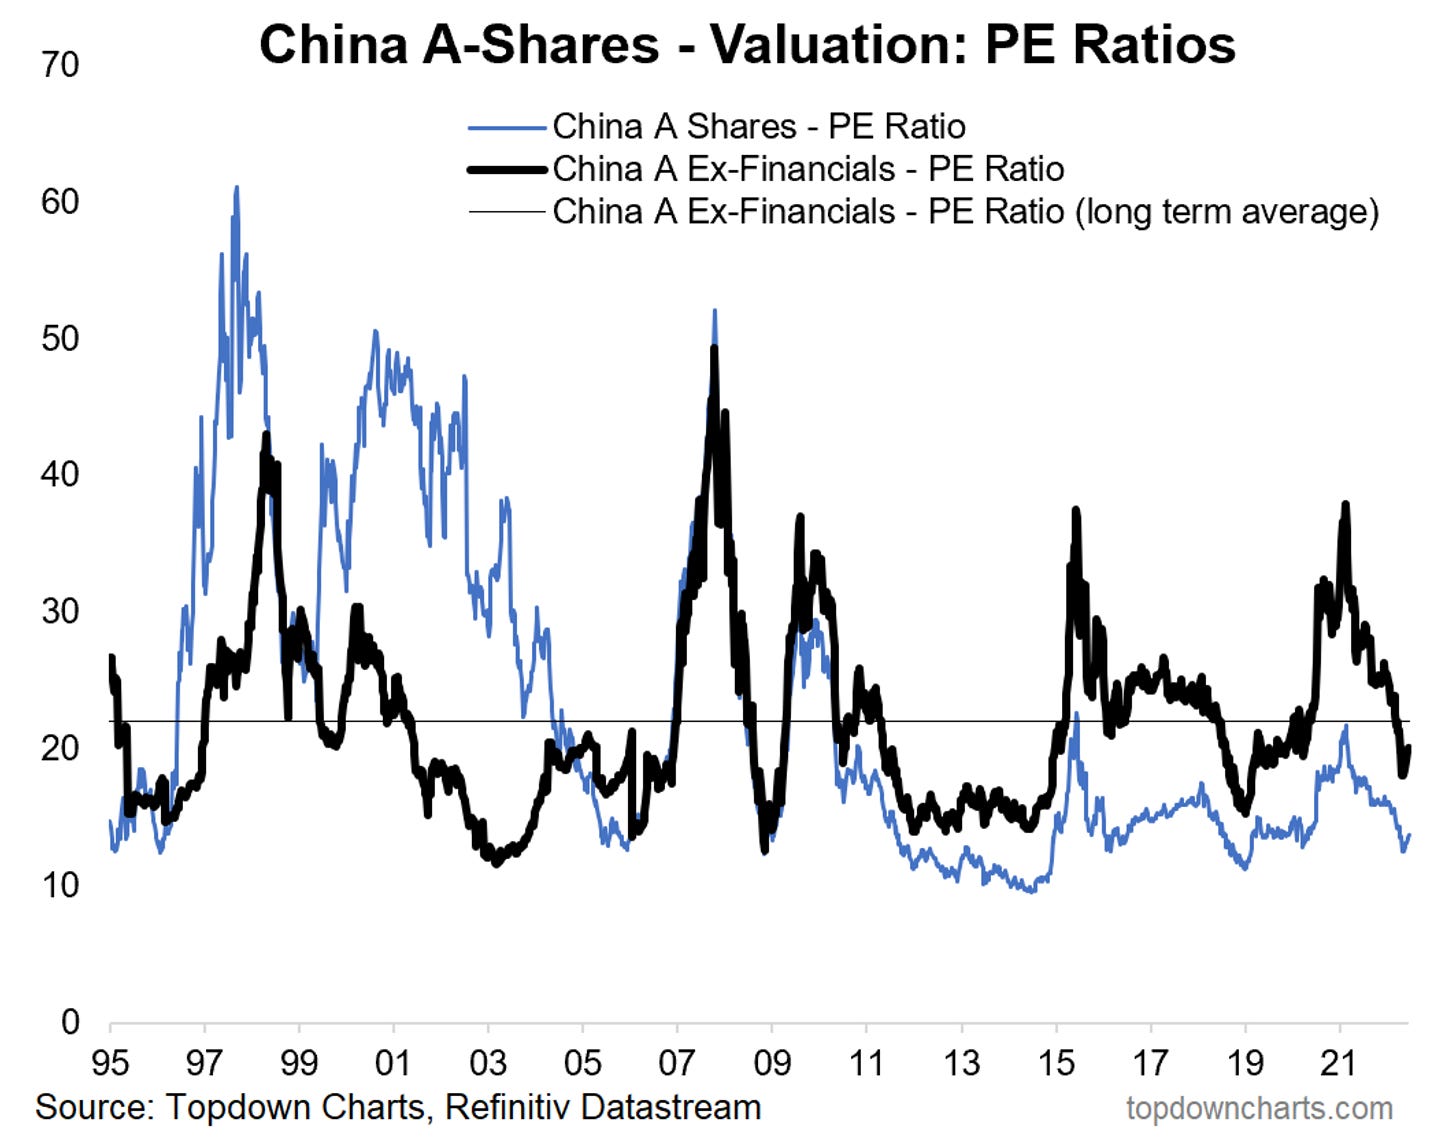
Chart of the Week - China Cheap Again
China A-Share Valuations: While much of the rest of the world is increasingly entrenched into bear market mode, Chinese equities are looking more and more interesting as China continues zigging while the rest of the world is zagging.
Valuation-wise, China A-shares are looking cheap after a period of weakness. And this is actually a change from recent times where valuations had gotten expensive after China managed to initially evade the virus but still benefit from global stimulus.
Ironically, now the virus (along with policy tightening and property downturn) have shifted things back into cheap/attractive territory. To be fair though, it is worth remembering for this market the 3 P’s (Policy, Property, Politics) are key, and while they previously imparted headwinds, there are early signs of progress.
And that is basically just a nod to the old truism in investing that cheap valuations alone are often not enough: you usually need some sort of macro-catalyst to kick things along. And we’re certainly doing a lot of research work on that front, and there are some interesting themes/trends emerging.
Meanwhile, from a technical standpoint, the bounce off of long-term support/uptrend-lines for both China A shares and the MSCI China index looks very compelling.
So a tick for technicals, and a tick for value.
Key point: China A-shares are trading on cheap valuations.
Oh, and one more thing, the reason why you see 2 PE ratio lines in this chart is because the most common pushback when you say China is cheap is something along the lines of yeah but that’s just because of bank stocks. So the black line provides some visibility on what valuations look like excluding the banks.
If you haven’t already, be sure to subscribe to our paid service so that you can receive the full reports ongoing (along with access to the archives, monthly asset allocation review, and Q&A).
ALSO: please feel welcome to share the Chart of the Week! I would greatly appreciate if you can help spread the word :-)
ALSO v2.0: a friendly reminder to upgrade to the “Add Quarterly Report“ option to receive a copy of our Q3 Quarterly Strategy Pack later next week, and gain access to the webinars + Q&A during the first week of July.
Topics covered in the latest Weekly Insights Report:
Tech Wreck Check: Valuations have improved, but still early days for tech.
Global Equity Technicals: Clear bearish momentum, few promising signs.
Monetary Markets: Heavy duty tightening and harder headwinds.
China aye Shares: Change in recommendation for Chinese equities.
NZ Equities: Some improvement made, but further downside likely.
Leveraged Equity Bets: No sign of material deleveraging as of yet.
Commodities: Indicators turning bearish for commodities.
Subscribe now to get instant access to the report so you can check out the details around these themes, as well as gaining access to the full archive of reports.
ALSO v3.0: On that note….. !! IMPORTANT ANNOUNCEMENT (/reminder)!!
Aside from that, I also wanted to take the opportunity to let you know that subscription fees for our entry-level service here on Substack will be going up in about 2-week’s time (yep, that’s right: inflation everywhere!!).
Fee hike details
These new rates will apply to *NEW* subscribers from the 1st of July 2022.
Monthly payments = $35/month (currently $30/month)
Annual payments = (unchanged i.e. $295/year)
“Add Quarterly Pack” = $899/year (currently $850/year)
As previously noted, I believe fee hikes are an important part of building a subscription research service as it rewards early supporters (they stay on the initial fee), and importantly: it (should!) reflect and incentivize elevation of quality through time (which I am committed to delivering on).
For more details on the service check out this recent post which highlights: a. What you Get with the service; b. the Performance of the service (results of ideas and TAA); and c. What our Clients say about it.
So the key point is: if you are interested be sure to get in before the fee hikes
Thanks for your interest. Feedback and thoughts welcome.
Sincerely,
Callum Thomas
Head of Research and Founder at Topdown Charts
Follow me on Twitter
Connect on LinkedIn


