
Chart of the Week - Bond Allocations
an ominous pattern in portfolio allocations has been detected...

Investor allocations to bonds have reached the lowest point since 2007.
We’ve seen this happen before.
Bond allocations reached major lows at both of the last two major stock market peaks (2000, 2007), and basically served as a bear market harbinger.
Aside from giving clues on the stage of the market cycle, this chart also served as a contrarian bullish indicator for bonds — with treasuries turning in strong double-digit returns after those two big troughs (and doing so while stocks dropped).
So I think this chart says as much about the stage of the market cycle, as it does about the importance of asset allocation (bonds performing their role as diversifiers and risk dampeners), but also about the big bullish setup in bonds in general.
As discussed the other day, bonds have all the makings for a contrarian bullish setup (cheap valuations, bearish sentiment, cycle-low allocations) — and, for now, lack only the technical and macro confirmation (the tactical/timing element).
In other words, don’t dismiss bonds in your asset allocation and portfolio strategy plans — and definitely don’t doubt their role as downside dampeners when the next big downturn comes.
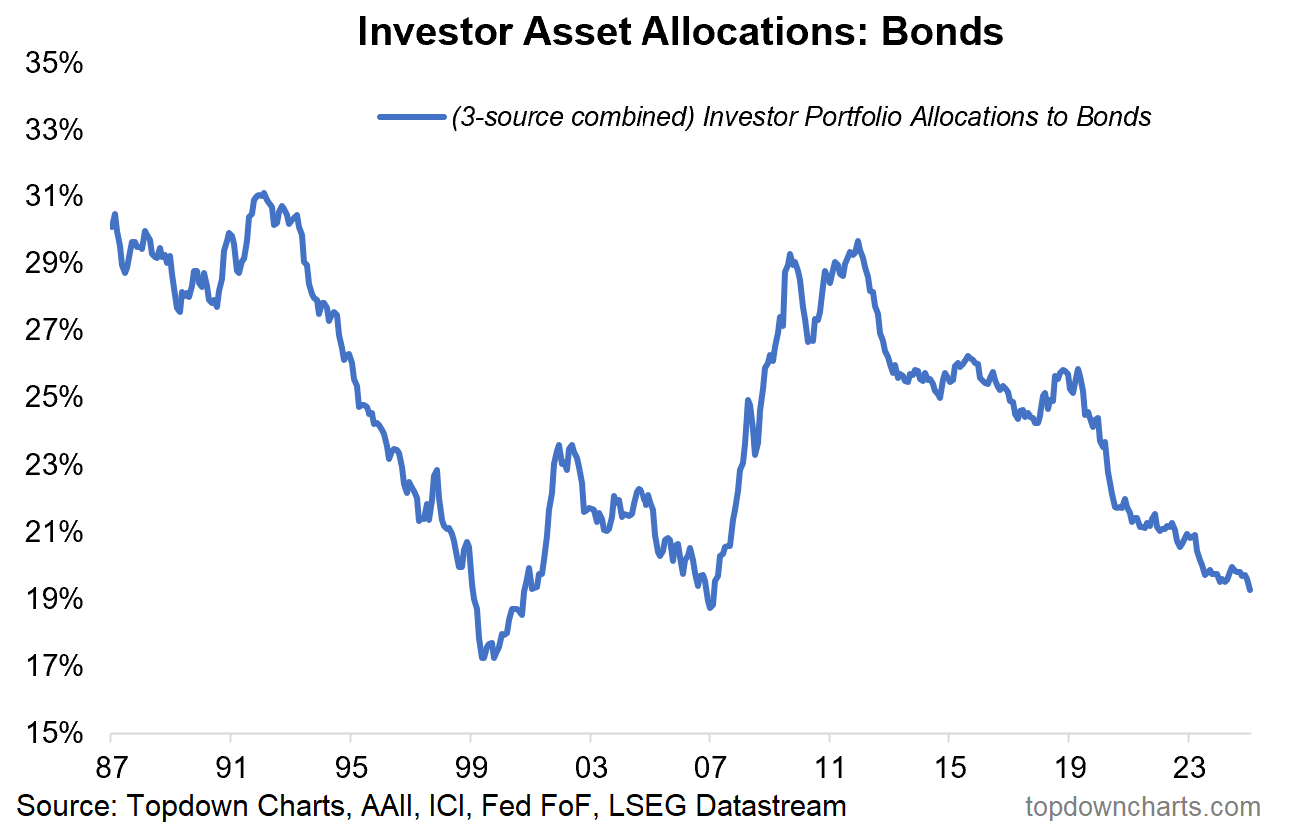
Key point: Investor allocations to bonds are at an 18-year low.
(n.b. the above chart combines data from the AAII survey, ICI aggregated fund assets, and US Federal Reserve Flow of Funds household accounts dataset)
Like this post so far? Please consider sharing it.
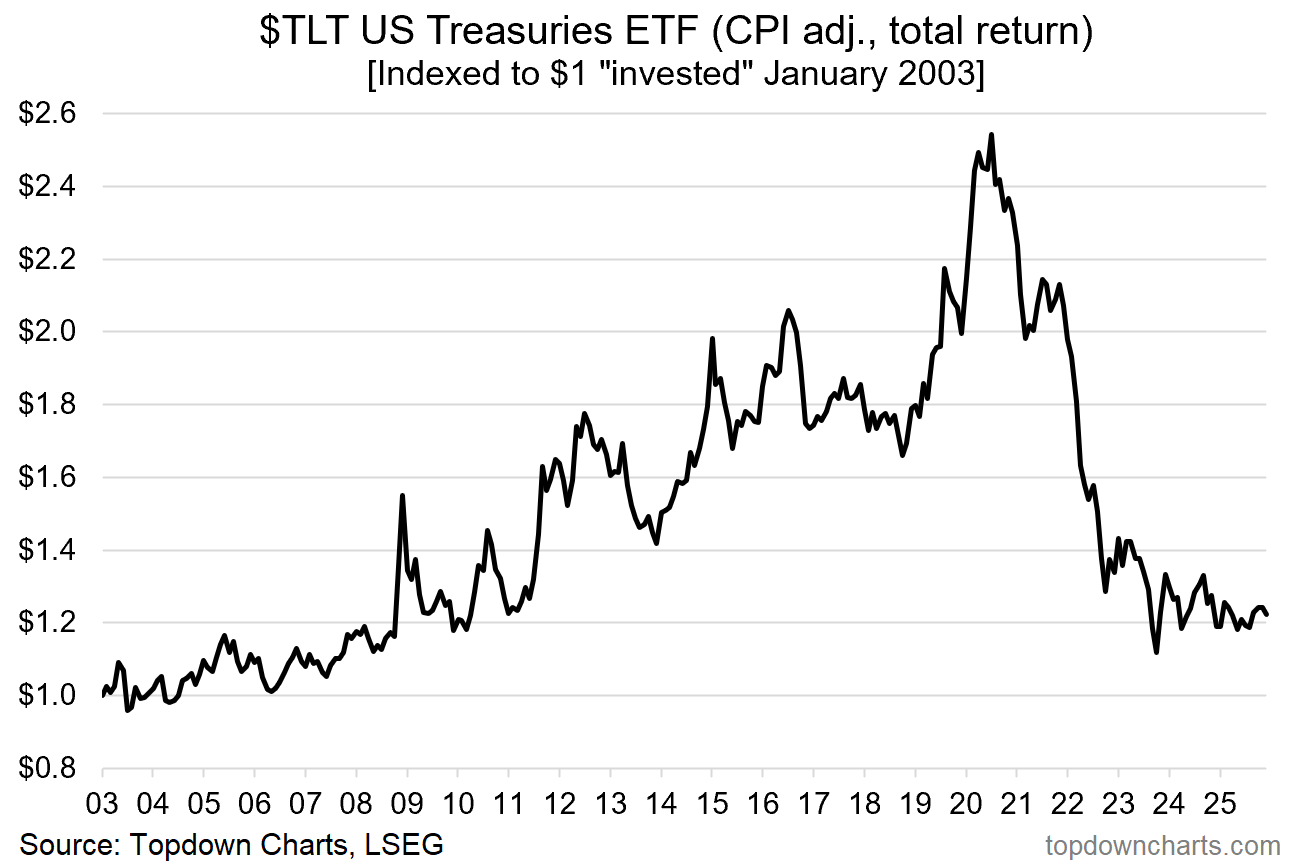
Bonus Chart — The 2020’s Treasury Bear Market
Now, some of you might be thinking: hmm yeah, ok, but we just saw bonds crap the bed during the 2022 mini-bear-market; and both stocks AND bonds ended up falling during that episode. Then add to that the fact that bonds are still basically in a bear market, and it would not be at all surprising to see some push back on the above sentiments I espoused.
And that’s actually a big part of the story here.
Investors have been scared and scarred away from treasuries, particularly as stocks have gone from strength to strength. That’s a big reason for why sentiment is so bearish on bonds, and why allocations have been drifted by market movements and active rotation down to the lows highlighted in the chart above.
It’s all part of the process of the market cycle, but I’d also hasten to point out that back in late-2021 my indicators were showing bonds (and stocks) as expensive and inflation risk was rising… in hindsight there were clear clues that bonds would end up being a source of risk rather than a dampener of risk back then.
But now that things have reset, I maintain and reiterate my assessment that bonds have a greater chance of playing their usual diversification and risk dampening role in the portfolio — especially in event of a deflationary downturn (recession).
So a fair bit to think about here, especially given the prevailing consensus…
n.b. If you haven’t yet, be sure to subscribe to the [free] Chart Of The Week series or better yet: Upgrade to Paid for Premium macro-market Content.
Bonds — What do you think?
(/how are you positioned? And please feel welcome to add your comments, context, critiques or questions in the comment section…)
p.s. Not a Paid Subscriber yet?
Be sure to sign up so you can access premium content including exclusive well-rounded ideas spanning risk alerts, investment ideas, and impactful macro insights to help make you a better investor — [ Sign Up Now ]
Topics covered in our latest Weekly Insights Report
Aside from the chart above, we looked at several other charts, and dug into some intriguing global macro & asset allocation issues in our latest entry-level service weekly report:
Global Markets Update: equities, fixed income, FX, commodities
Crude Oil Outlook: technicals, key levels, relative value, catalysts
Treasuries: the big picture setup for bonds
EM Fixed Income: looking at EM sovereign bonds asset class
Emerging Market equities: short-term risks vs bigger picture outlook
LatAm equities: the big bullish setup vs the window of risk
Defensives: basket of healthcare, utilities, consumer staples
Subscribe now to get instant access to the report so you can check out the details around these themes + gain access to the full archive of reports + flow of ideas.
For more details on the service check out the following resources:
Getting Started (how to make the most of your subscription)
Reviews (what paid subscribers say about the service)
About (key features and benefits of the service)
But if you have any other questions definitely get in touch.
What did you think of this note?
(feel free to reply/comment if you had specific feedback or questions)
Thanks for your interest. Feedback and thoughts welcome.
Sincerely,
Callum Thomas
Head of Research and Founder at Topdown Charts
Follow me on Twitter
Connect on LinkedIn
NEW: Services by Topdown Charts
Topdown Charts Professional —[institutional research service]
Topdown Charts Entry-Level Service —[entry-level version]
Weekly S&P 500 ChartStorm —[US Equities in focus]
Monthly Gold Market Pack —[Gold charts]
Australian Market Valuation Book —[Aussie markets]
What type(s) of bonds are included the graphed data?
Perfectly logical, but a word of caution: The president has some advisors who see the best way to solve the 38 Trillion debt is to devalue the dollar about 40% for a 'reset', and I believe he might do it. After all, he hasn't shown any timidity about other surprising moves. A sudden, overnight devaluation would reset bonds and other cash investments drop immediately. I don't like the risk, so will stick with hard assets. They can go down in a depression, but not in a panicky way. Not sure how bitcoin would fare - your thoughts?