
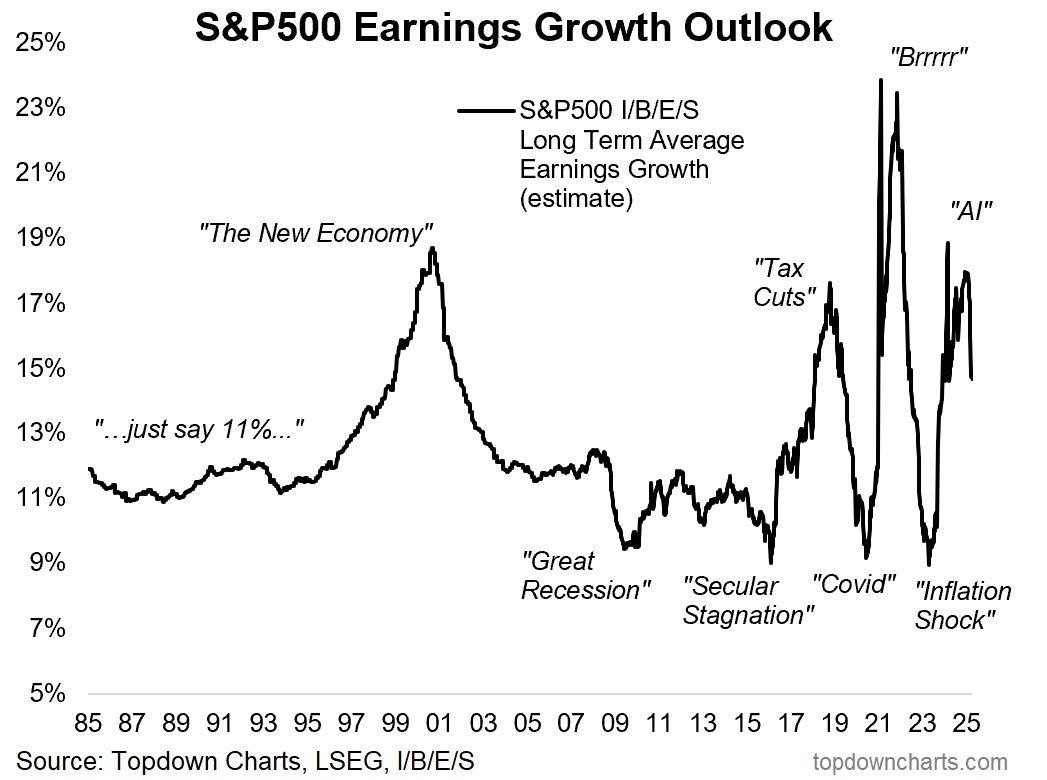
Chart of the Week - Boomtown or Bust
Zooming out, it's basically a textbook study of market cycles...

This week’s chart was featured in the latest Weekly ChartStorm, but I felt it worth sharing over here as well and probing further into the core issue in markets right now (at the bigger picture level).
You see, the reason I add that parenthetical is that my sense is most people are too bogged down in the day-to-day, tick-to-tick, ebb-and-flow of the constant news/noise flow and volatility.
And so it’s easy to lose sight of the larger trends and cycles underway at the moment.
The thing I emphasized in the ChartStorm was the Changing Tides… consider the following data points and observations:
Wall Street analyst Earnings expectations are rolling over from ebullient levels (see today’s chart).
Investor Sentiment is rolling over from record highs (e.g. Euphoriameter).
Consumer Confidence in the Stockmarket is likewise slumping from a record high back in November.
Investor portfolio allocations to stocks are peaking at record high levels.
Margin Debt expansion has peaked and rolled over from warning levels.
Valuations are moving lower from previous extreme expensive levels (and are still a long way from becoming cheap).
The stock/bond ratio is rolling over from stretched levels (and a very low forward-looking equity risk premium); likewise bond yields are rolling over from the peak (+unemployment rate is turning up off the lows).
And credit spreads are starting to trend up (from 17-year lows).
Then also consider this background context: developed ex-US and emerging market equities have been through a long period of stagnation and underperformance (which is now changing) —along with a decadal run of strength in the US dollar which reinforced a 15-year run of outperformance by US vs Global equities…
In other words, for a while there in terms of global equities, all roads led to the USA (and with hindsight: for good reason, they had a golden decade and a half).
But along with various datapoints mentioned above, the US dollar and US vs global stocks relative performance is likewise turning the corner.
The key point is it’s all internally consistent… The big picture prognosis is the tides are changing. It all has a look and feel of your traditional market cycle peaking and then rolling over — which is the worst time to hold risk assets from a market timing and risk management standpoint (and the best time to lean into defensives and diversifiers from an asset allocation perspective).
So whether we get this tariff or that tariff, whether this geopolitical thing happens or that fiscal contraction occurs, or whichever confidence shock and uncertainty comes… the main issue is the market cycle and the mounting body of evidence which all says the cycle has moved from boomtown toward bust.
Key point: Zooming out, the big picture is that the market cycle is turning down.
Quarterly Strategy Pack — Webinar Invite
Thanks for following Topdown Charts, as a token of my appreciation I would like to invite you to a webinar session to go through my latest Quarterly Strategy Pack.
In this session we will cover:
The global macro/risk outlook
Specific asset class views
Other issues and ideas
Asset Allocation
The session will be held at 3pm EST Wednesday 2nd April 2025. I will also post a replay later in the week. Q&A is welcome.
See registration link: https://us06web.zoom.us/webinar/register/WN_bvDu-xx8TVqC2MshUK2qjQ
This will also be a good chance to get a greater insight into my work here at Topdown Charts, which will be particularly useful if you were ever considering a subscription to the Topdown Charts Professional service (or the Entry-Level version).
I look forward to having you join us on the call.
It will be a timely look into some of the most important themes, significant risks, and major opportunities for the year ahead and beyond…
Sentiment vs Valuations and Market Cycles
When it comes to the market cycle it’s easy to lose sight of concepts during chaos. Meanwhile oversimplified schematics often instill a false sense of confidence. So I thought it would be worthwhile revisiting my “nuanced version“ of the market cycle.
The simple version says that you go in a nice orderly fashion from boom to bust, expensive to cheap, and all you need to do is buy low and sell high. In practice emotions, peer pressure, industry forces all conspire against us through every step of the way. That’s why you need to be data and evidence driven in forming a clear view of where you are at in the cycle and what kind of forward-looking risk vs reward setup is on the horizon.
As I attempt to explain in this visual, the best time to go all-in on stocks is when the cycle is turning up from the lows (if you go too early you risk falling into value traps and the perils of catching a falling knife).
On the flipside, the worst time to be all-in on stocks (and best time to lean into defensives, diversifiers, and hedges) is when the market turns down from the highs (again, if you go too early you risk getting left behind, falling victim to FOMO, and if you’re in the profession; getting fired).
Lastly, I’ll leave you with a quote from myself:
“don’t take it in a negative or pessimistic sense, it’s about learning to love the cycle; to be a victor not a victim of the cycle, and above all to keep perspective.”

Topics covered in our latest Weekly Insights Report
‘Here’s what was covered in the latest weekly report from our Entry-Level service:
Market Update: equities, rates, credit, commodities
US Dollar Outlook: big picture view on the DXY
Macro Risk Radar: key things to watch for this week
Ideas Inventory: current live views and ideas
Subscribe now to get instant access to the report so you can check out the details around these themes, as well as gaining access to the full archive of reports.
For more details on the service *check out this recent post* which highlights:
a. What you Get with the service;
b. the Performance of the service (results of ideas and TAA); and
c. What our Clients say about it.
But if you have any other questions on our services definitely get in touch.
Thanks for your interest. Feedback and thoughts welcome.
Sincerely,
Callum Thomas
Head of Research and Founder at Topdown Charts
Follow me on Twitter
Connect on LinkedIn
NEW: Services by Topdown Charts
Weekly S&P 500 ChartStorm [US Equities in focus]
Monthly Gold Market Pack [Gold charts]
Topdown Charts Professional [institutional service]
Australian Market Valuation Book [Aussie markets]
Thanks Callum, this is very helpful. It looks like we're in the "head for the exit" leg of the cycle