
Chart of the Week - Bullearish
The most *bullish* AND *bearish* chart(s) in Global Equities right now...

This week’s COTW is… 2 Charts!
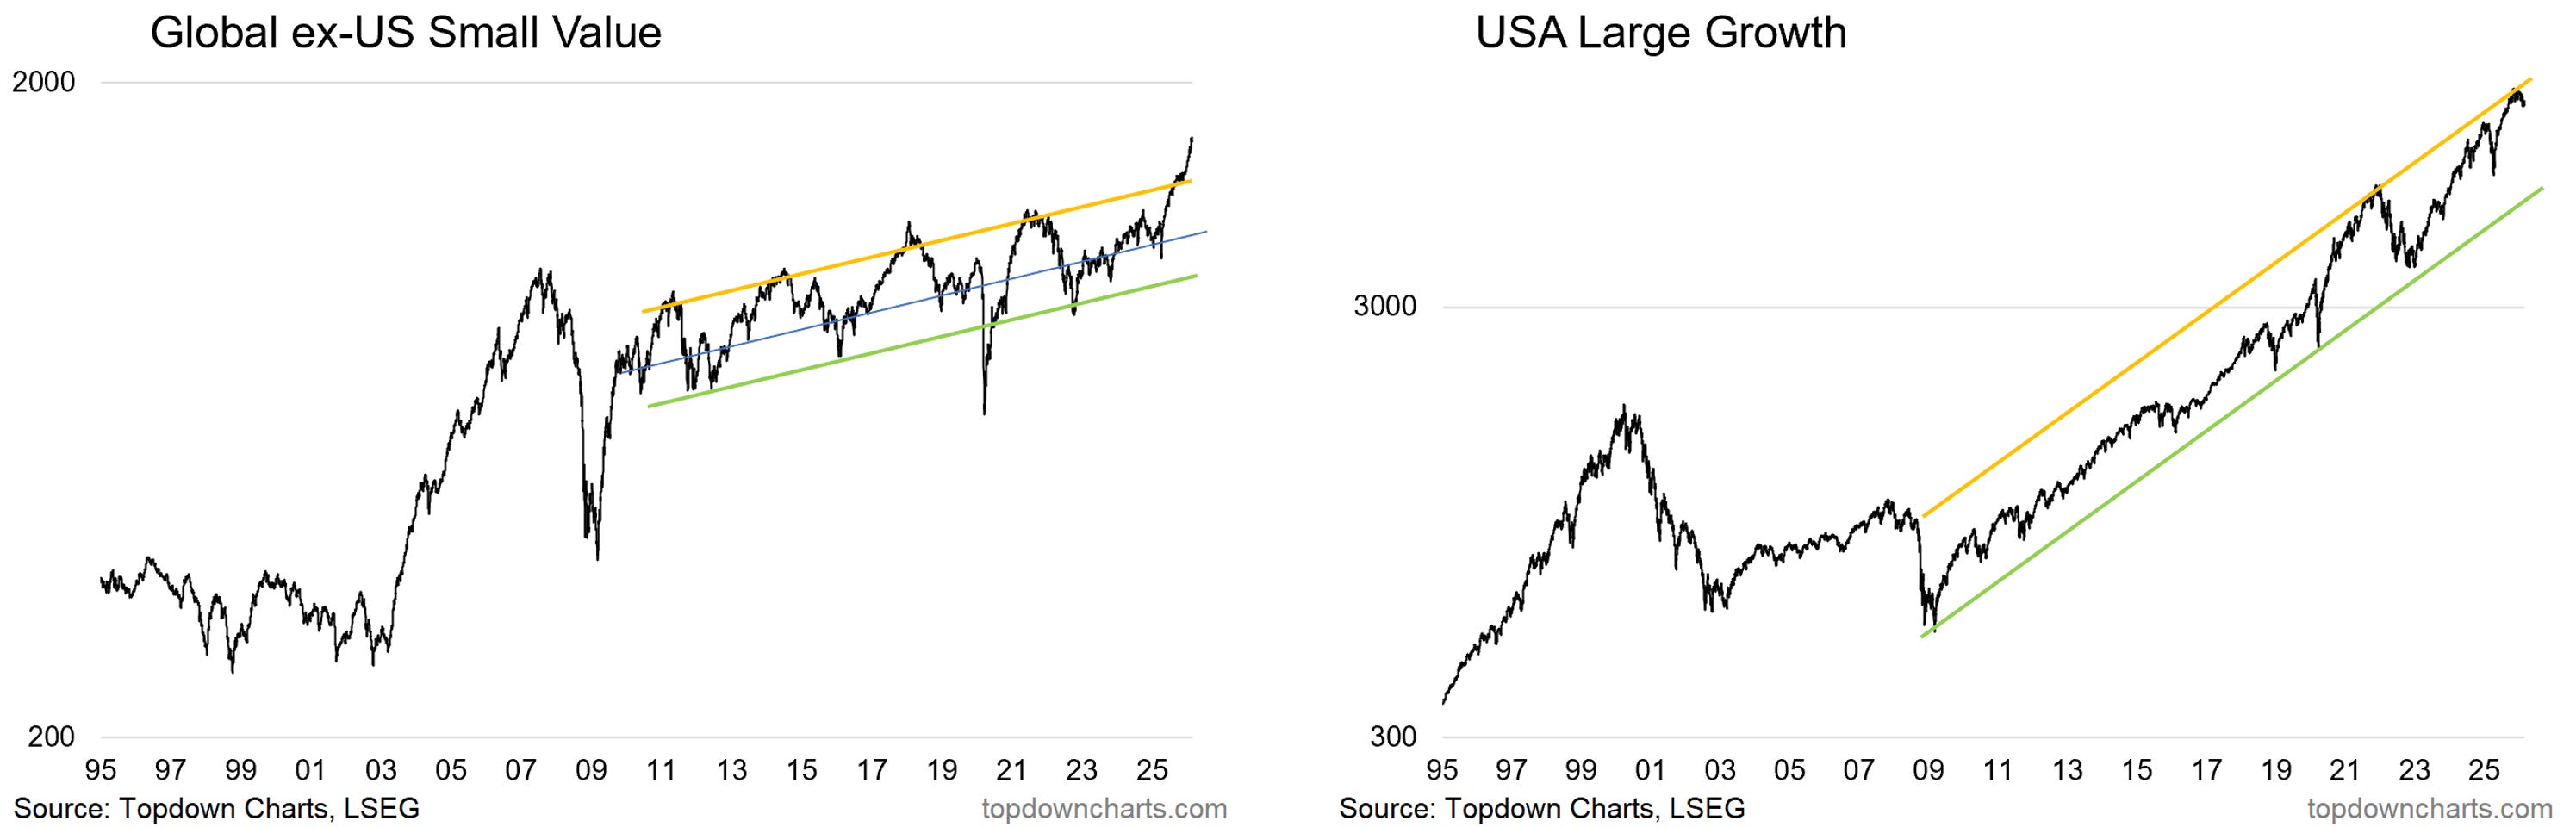
First one shows Global ex-US Small Value (basically a combination of what have been the 3 most out of favor parts of global equities: global ex-US, small caps, and value stocks).
The second one shows the other side of the coin — US Large Growth (what has been the hottest part of global equities).
The chart on the left is looking very bullish after being messy, somewhat bearish, and certainly lagging behind for a number of years.
The chart on the right is looking distinctly bearish after having been on a dream bull run since 2009.
Then add in a little more context: global/small/value are ticking up from record low relative valuations vs US/large/growth — what I call the “relative value trinity“ of global equities.
This is a classic change in stockmarket leadership, and something I’ve been terming bullish rotation. I thought we would see this happen at some point, but I wasn’t sure if it would end up being bullish rotation (where global/small/value start putting in good absolute and relative performance, and catching up) or bearish rotation (where both fall, but one falls less than the other, and US growth catches-down).
As such, I’d call this pair of charts collectively bullish in that the “relative value trinity” group (global/small/value) are picking up the slack from lackluster US large growth/tech.
But at the same time, you take one glance at the chart on the right and that doesn’t look too good …and in fact it shares many similarities with 2021/22.
That’s what we call bullearish.
Key point: Global/Small/Value are leading the charge in global equities.
Rotation Stations…
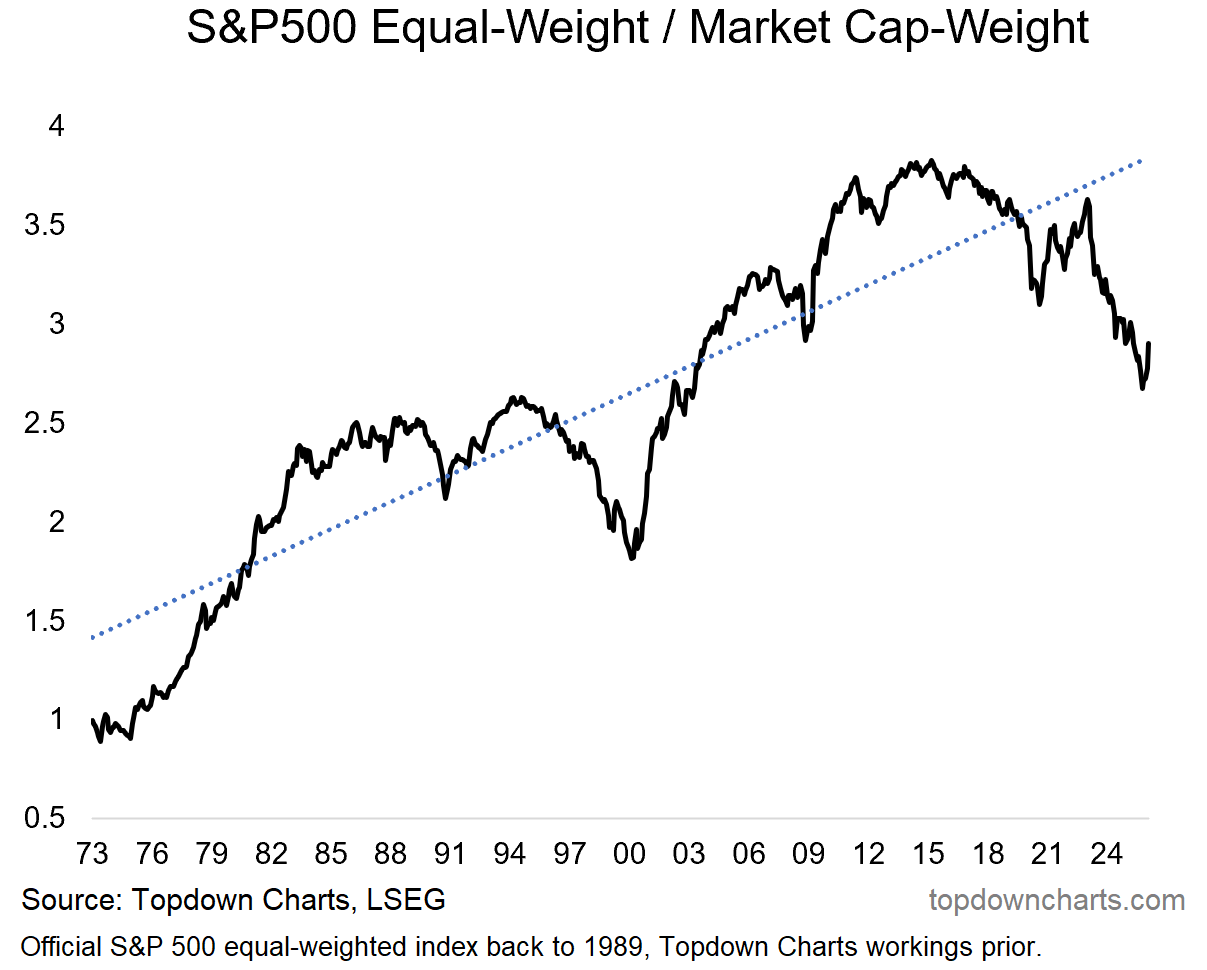
The chart below was featured in the latest edition of The Weekly ChartStorm and echoes the themes outlined above.
Within the US we are seeing the bull market broaden out to areas of the market that had previously lagged behind such as small caps, cyclicals, value stocks as the equal-weighted version of the S&P500 starts to outperform (rather than just the heavy-weights of US big tech hogging it all).
With global growth on the rebound into 2026, commodity prices ramping-up, and fiscal/monetary tailwinds pairing-up with the positive real-world flow-on effects of the AI boom, this is not just a technical rotation but a fundamental rotation (there is good reason for stocks ex-tech to rally this time).
And yet, this is a huge development technically: consider how stretched from trend the black line in the chart below had become — look for a massive trend-reversion in the coming months and years.
p.s. Not a Paid Subscriber here yet?
Be sure to sign up so you can access premium content including exclusive well-rounded ideas spanning risk alerts, investment ideas, and impactful macro insights to help make you a better investor — [ Sign Up Now ]
More Rotation!
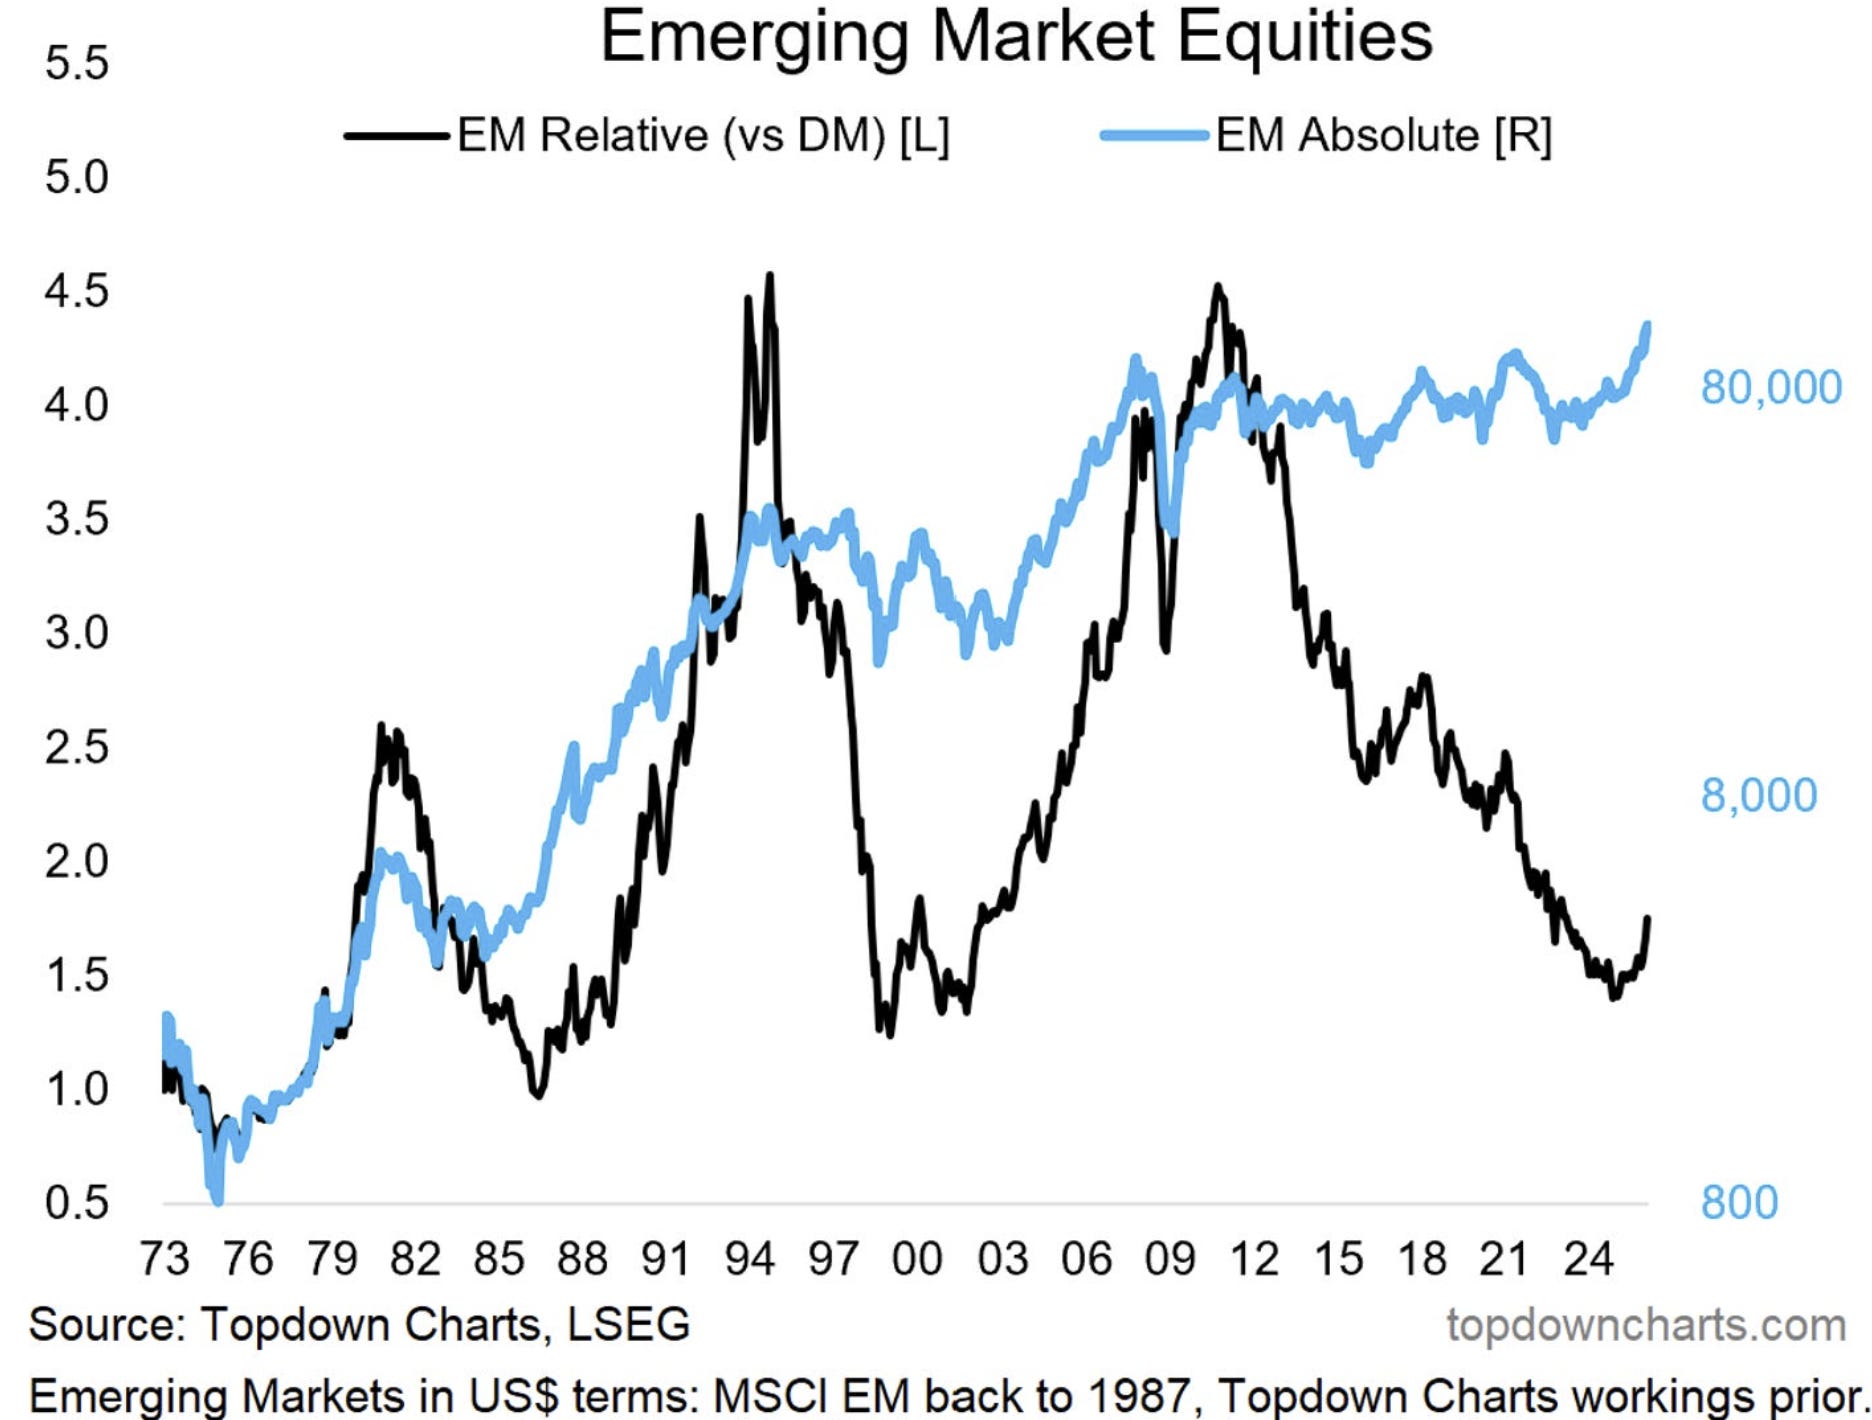
A key sub-component of global equities rotation has been the massive inflection point in Emerging Markets.
Emerging vs Developed market relative performance (black line) is turning up following a decade+ relative bear market, and the Emerging Markets index (blue line) is breaking out in absolute terms after putting in a Brobdingnagian base.
Even if you’re not a fan of technicals, you’d have to admit that in this brief email we’ve covered what are likely to be some of the most significant developments in global equities this decade (and for reference, the fundamentals/value backdrop do indeed support the technicals assessment).
More updates to come! [Follow Topdown Charts + The Weekly ChartStorm to stay on top of the emerging risks + opportunities as this unfolds…]
For more Charts and Market insights be sure to head over and check out my other service, The Weekly ChartStorm
For more info on The Weekly ChartStorm service see:
I hope to see you also join us over on The Weekly ChartStorm for some of the best weekly insights on the Stockmarket (+related issues).
Thanks for your interest.
Best wishes,
Callum Thomas
Founder & Editor of The Weekly ChartStorm
and Head of Research at Topdown Charts
Follow me on Twitter
Connect on LinkedIn
See Also — The Weekly ChartStorm for more updates on markets…

China Charts of the Months: https://igreaterchina.substack.com/p/chinese-economy-in-5-charts-2026?r=gf5z1