Chart of the Week - Deflation vs Inflation
The Rise of Deflation: It’s time to have a conversation about deflation risk.
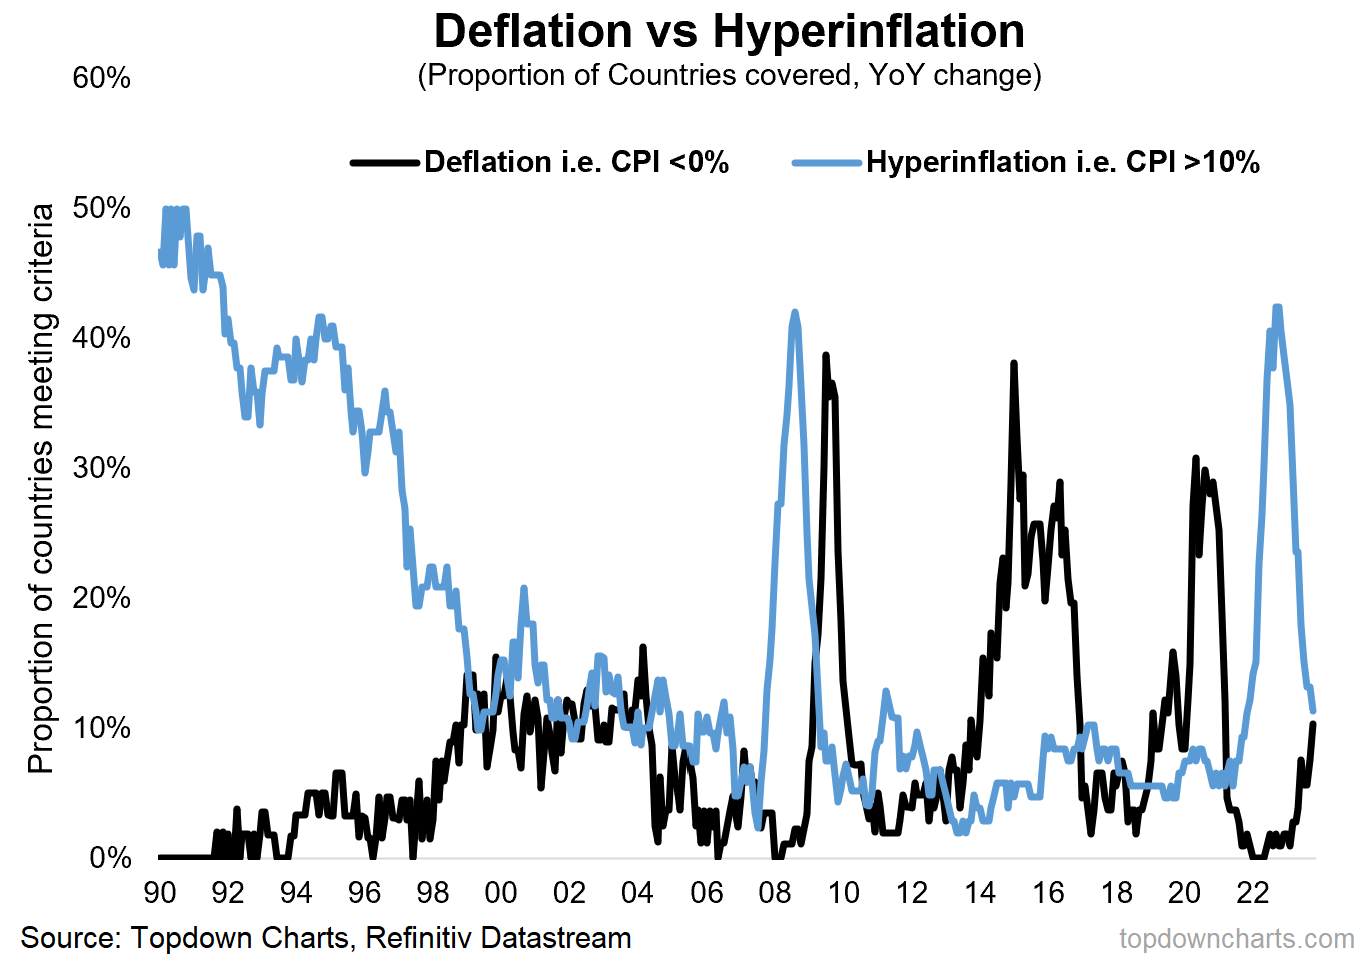
And actually, looking at the global breadth of countries experiencing “deflation” (negative YoY CPI readings) — this is not so much a risk as a reality. As of the October data releases so far just over 10% of countries tracked (out of over 100 countries) are in deflation. This stands in contrast to a reading of 0% in early-2022.
It also contrasts to the surge and peak in countries experiencing hyper/higher- inflation (readings greater than 10% in this case), and those lines in the chart are about to cross… demarcating a transition in macro regime.
But how do you get to deflation risk, and so-what if we do?
Firstly, and frankly, one way to get to deflation is having a high base-comparator (if peak inflation was 12-months ago, then unless inflation continued to accelerate it’s going to naturally, mathematically drop or at least decelerate on a year-over-year basis).
But more to the point, and in terms of underlying inflation vs deflation pressures, we have seen: substantial, rapid, and widespread tightening of monetary policy (and broader tightening of financial/credit conditions), a reversal of supply chain issues and backlogs, a tipping of commodities into cyclical bear market, recessionary dip in global trade and manufacturing — and clear macro downdrafts in China and Europe (recession-adjacent).
On top of that, there are several central banks (who shall remain nameless) that I would say are on the cusp of or in the process of making policy mistakes (both in terms of overcooking rate hikes, and undercooking easing).
That’s all a reliable recipe for disinflation at the very least, and that has obviously already happened, but the logical progression is a foray into deflation.
But so what?
Well, if we get a sharp and widespread shift into deflation globally, then bonds rally, gold gets a boost (lower real yields, removal of previous monetary headwinds), and stocks… well, that depends.
Stocks often do OK during inflation (unless rates tighten too quickly) because they get to bank higher nominal growth in the form of higher sales [to the extent that they have decent operational leverage and can pass on costs and/or greedflate prices]. Lower nominal growth could therefore mean lower sales. But more practically, in reality the most common driver of deflation is recession. And that brings you back to the recession yes-or-no debate, and if recession = yes: then stocks don’t do well (and bonds beat stocks).
The other aspect is how fast to central banks unwind rate hikes. EM central banks are already kicking off their rate cut cycles, but developed markets may be reluctant — scared or scarred by the ghosts of the 1970’s premature easing and inflation shocks. Again, that’s probably more of a recession (or crisis) yes-or-no issue.
So in some respects the deflation discussion is a veiled way of talking about recession risk, but it’s also a coming full-circle of the many macro cross-currents that stirred up in the wake of the pandemic. And that means it is indeed time to start talking about deflation risk.
Key point: Deflation is (naturally and logically) on the rise globally.
SPOTLIGHT: “The Weekly ChartStorm”
There’s a reason why over 30,000 people follow The Weekly S&P500 #ChartStorm – it provides a balanced and unbiased fact-check on the market. Each week it serves up 10 charts that capture the key drivers of risk and return …helping you identify opportunities in the short-term as well as offering unique perspectives on longer-term trends.
Subscribe now, get charts, gain perspective.
Topics covered in our latest Weekly Insights Report
Aside from the chart above, we looked at several other charts, and dug into some intriguing global macro & asset allocation issues on our radar:
Global Equity Technicals: key trigger points as we head into 2024
Inflation: expect global disinflation trend to continue; deflation risk next
China Macro: property market downturn worsens, stimulus needed
Chinese Equities: stimulus stalemate vs valuations and policy puzzles
US Housing Market: difficult math, mortgage jail, valuation adjustments…
Subscribe now to get instant access to the report so you can check out the details around these themes, as well as gaining access to the full archive of reports.
For more details on the service *check out this recent post* which highlights:
a. What you Get with the service;
b. the Performance of the service (results of ideas and TAA); and
c. What our Clients say about it.
But if you have any other questions on our services definitely get in touch.
Thanks for your interest. Feedback and thoughts welcome.
Sincerely,
Callum Thomas
Head of Research and Founder at Topdown Charts
Follow me on Twitter
Connect on LinkedIn


