Chart of the Week - Emerging Market Equities
This week: quarterly pack highlights, EM equities, credit spreads, growth vs inflation, US CPI outlook, global vs US equity valuations, China equity technicals...
This email gives you a brief overview of what was covered in the latest Weekly Insights report including of course, the Chart Of The Week.
Check out the full archives of the Chart Of The Week for more charts.
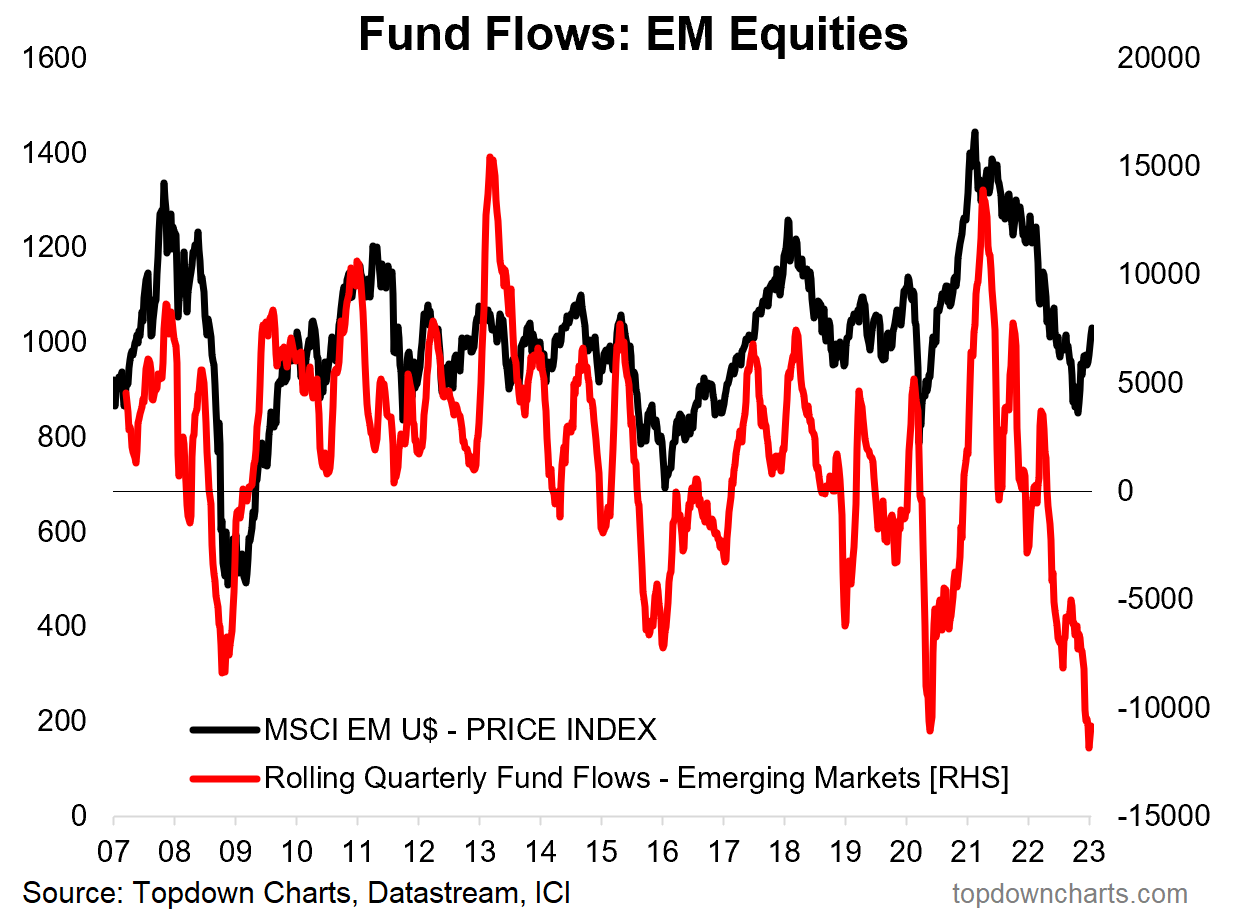
Chart of the Week - EM Equity Fund Flows
Investors Abandoned EM: Emerging Market equity funds have seen record redemptions by investors, and that came just as EM equities reached their nadir and subsequently turned sharply higher.
When sentiment gets that depressed it doesn't take much of an excuse to turn things around, even at least if just short-term (and risks do remain). The excuses or catalysts in this case came in the form of China reopening and a rapidly weakening US dollar.
Technically things are looking up for EM equities, the index has broken out vs a key resistance level (and vs its 200-day moving average), and with strong breadth, and with confirmation from improvement in EMFX.
So it’s entirely possible that EM equities see further follow-through as the same investors that previously dumped their holdings scramble to get back in!
Key Point: EM equity funds saw record outflows — right at the turning point.
Please feel welcome to share the Chart of the Week!
I would greatly appreciate it if you can help spread the word ↓
The easiest way to help do that is to simply forward this email to your friends, or you can just share the chart/link on social media (be sure to mention us! :-).
Topics covered in the latest Weekly Insights Report
Aside from the chart above, we looked at several other charts, and took a bite out of some really important macro/asset allocation issues right now:
Credit Spreads: Complacency is setting in for credit spreads.
EM Equities: Reviewing the tactical outlook as the charts improve.
Global PMI Indicators: Growth is dropping, and inflation pressures easing.
US CPI Outlook: Energy disinflation is a key driver of lower inflation.
Global vs US Equities: A look at valuations and macro drivers.
China Equity Technicals: Two very interesting charts for long-term investors.
Subscribe now to get instant access to the report so you can check out the details around these themes, as well as gaining access to the full archive of reports.
For more details on the service check out this recent post which highlights: What you get with the service; Performance of the service (results of specific ideas and TAA); and importantly: What our clients say about it…
But if you have any other questions on our services definitely get in touch.
Thanks for your interest. Feedback and thoughts welcome.
Sincerely,
Callum Thomas
Head of Research and Founder at Topdown Charts
Follow me on Twitter
Connect on LinkedIn


