Chart of the Week - Higher For Longer
Higher for longer risk is becoming reality for US Treasury Yields..
As geopolitical risk looms, bonds — typically a safe haven defensive asset, which typically get bid up in times of risk and uncertainty — are… getting further sold-off.
There’s two reasons for this: 1. Further flare-up and escalation in the Middle East geopolitics is likely to push up oil prices, inflation, and bond yields; but perhaps more important; 2. The main underlying current is one of reacceleration and inflation resurgence risk, and that is setting the tone and arguably speaking louder than the evolving geopolitical risk backdrop.
We saw a shot across the bows last week on this with the stickier than expected underlying inflation measures… meaning that all those expected Fed rate cuts everyone was looking for are as a minimum going to be smaller and later than expected, and the tail risk is that the next move could even be higher on rates.
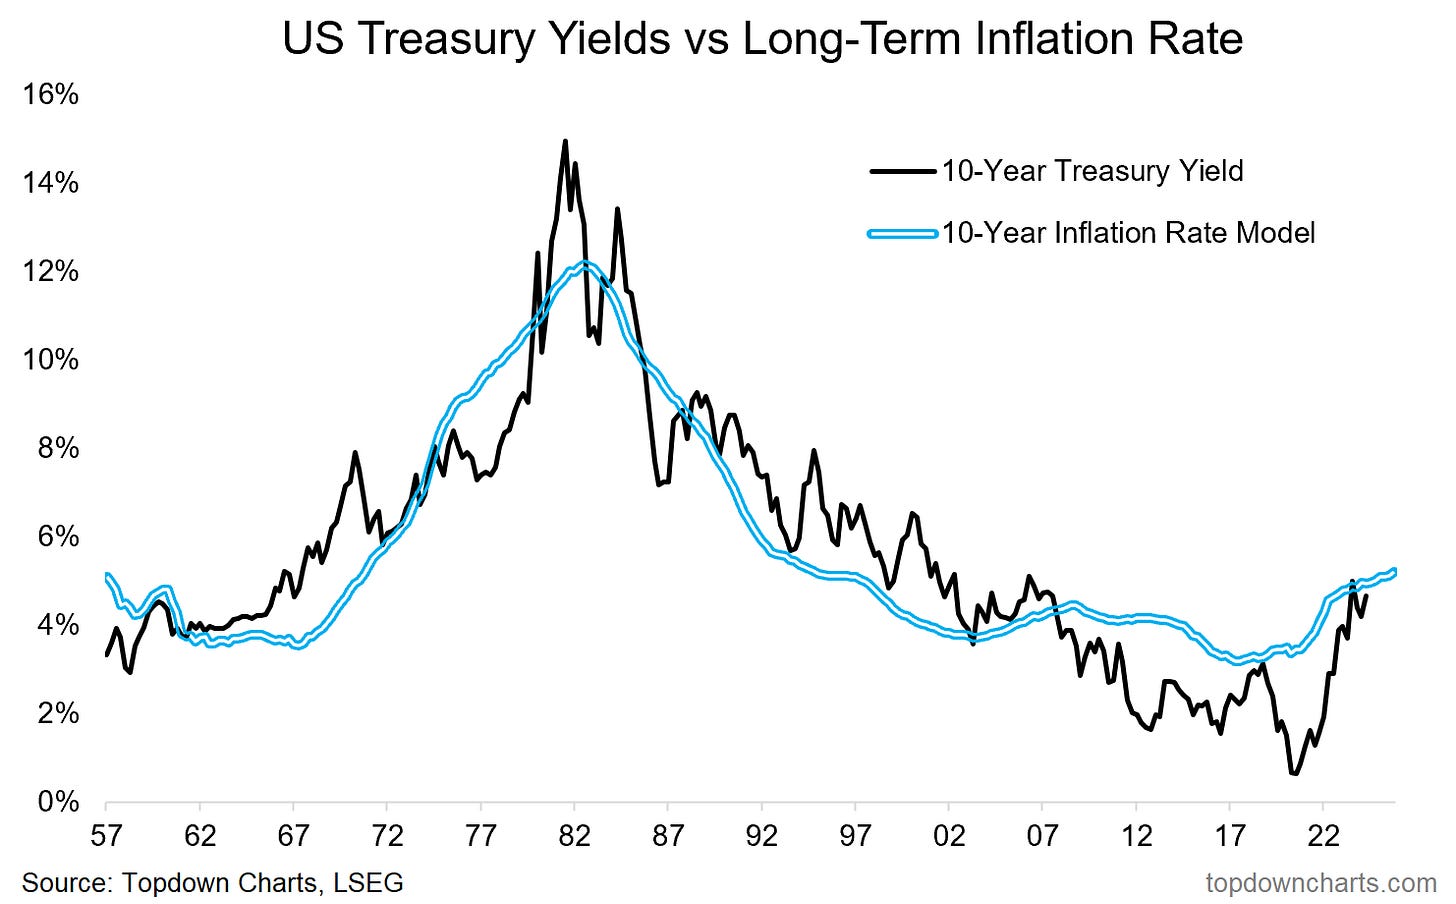
Today’s chart highlights the linkages between inflation and bond yields.
The long-term rate of inflation model is a good predictor of the approximate level of bond yields over time, and is currently pointing to levels around 5%. But naturally, with many things like this there is every chance of overshooting the fair value yard stick.
Inflation resurgence of course would see that yard-stick move higher.
But here’s the thing, even if we forget about the (very real) risk of inflation resurgence, and just assume inflation eases back to the Fed’s 2% target, that is going to mean an elevated and actually upward drifting long-term rate of inflation over the next year.
AKA — higher for longer, at least for bond yields.
So while I want to be bullish bonds because of cheap valuations, and a handful of macro/market models that still point to the potential for lower yields (and an outside, but arguably current lower risk of recession), for now the technicals and fundamentals suggest the path of least resistance is for bond yields to head higher, or at the very least just make themselves right at home in this new higher range.
Key point: A higher long-term rate of inflation = higher for longer level of bond yields.
See also: Archive of previous Chart Of The Week reports
Topics covered in our latest Weekly Insights Report
Aside from the prospect of higher for longer risk, here’s the key topics and issues covered here in our entry-level service (which provides a summary/key points from the full service which I talked about above):
Markets: updated on stocks, bonds, volatility, FX, and commodities
Defensives Defeated? looking at weakness + opportunity in defensives
Treasuries: examining higher for longer risk and bond yields
EM Sovereign: the upside vs the cross currents in EM debt
Commodities: piecing together the compelling bull case
Commodity Equities: new innovative coverage and indicators
Agri: the underappreciated risks in agri commodities
Subscribe now to get instant access to the report so you can check out the details around these themes, as well as gaining access to the full archive of reports.
For more details on the service *check out this recent post* which highlights:
a. What you Get with the service;
b. the Performance of the service (results of ideas and TAA); and
c. What our Clients say about it.
But if you have any other questions on our services definitely get in touch.
Thanks for your interest. Feedback and thoughts welcome.
Sincerely,
Callum Thomas
Head of Research and Founder at Topdown Charts
Follow me on Twitter
Connect on LinkedIn


