Chart of the Week - Renewable Energy Value
The value case for renewables has been... renewed :-)
Chart of the Week - Value in Renewable Energy Stocks
Sector Valuations: One sector that got carried away by the liquidity tsunami that swept across global markets following the pandemic stimulus measures in 2020 was renewable energy stocks. But they also had the extra boost from a speculated Biden bump that was to come from the new President’s focus on clean energy.
As it turned out, both of those tailwinds came and went, and took renewable energy equities on a wild ride: up 4x off the lows, and then down more than -60%. The relative performance against fossil fuel equities was even more pronounced (initially up 5x vs oil & gas stocks - peaking in early 2021, and then underperforming -75%).
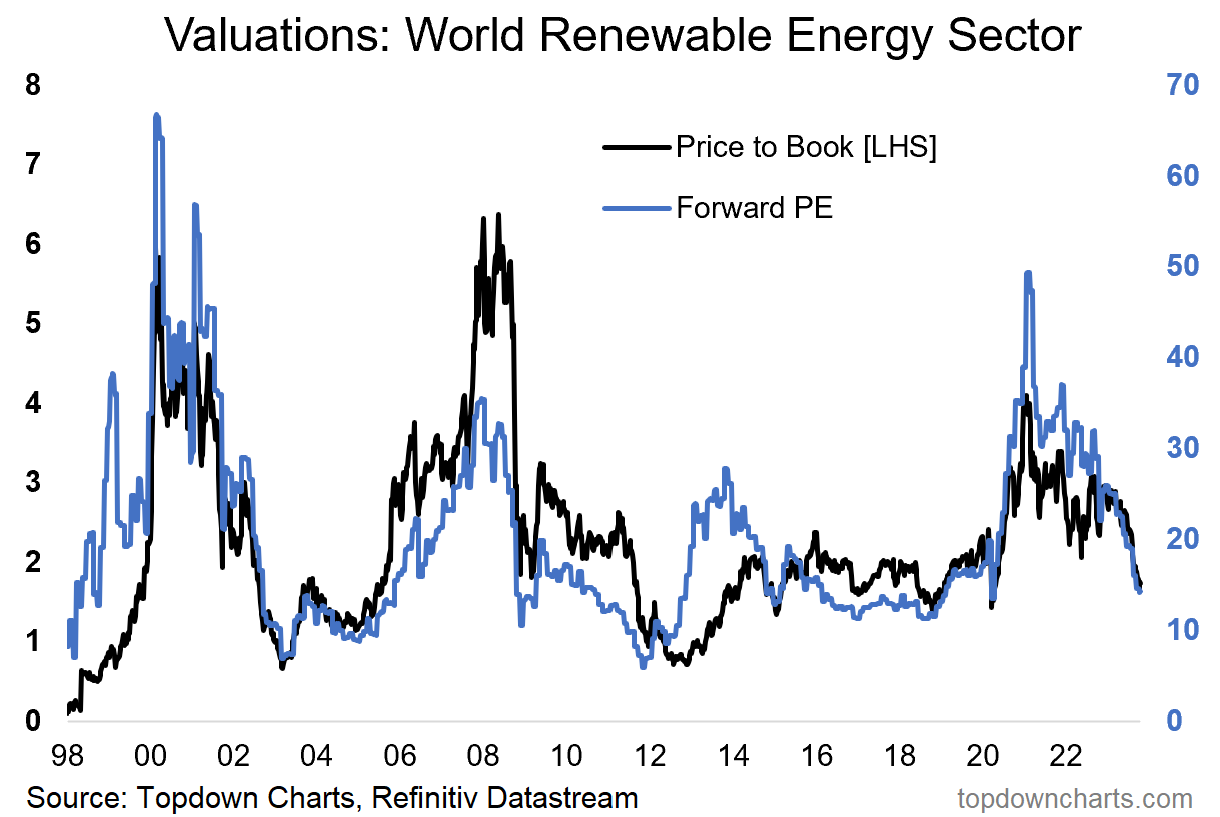
But with great fall, comes great value. At the peak, renewable energy sector valuations were eyewatering, and on par with some of the previous ebullient episodes that the sector had gone through.
But now, the value case for renewables has been… renewed. Forward PE ratio and price-to-book ratios for the sector are back towards the low end of the range. Investors have given up on the sector (especially as oil & gas stocks have put in superior performance).
(n.b. in this analysis I am using the Refinitiv Datastream total market index, which is about 40% solar, 35% wind, and 25% storage/hydrogren/other, and geographically 40% USA, 40% Europe, 20% RoW)
So as investors say “good bye” to the sector, I would start to look at these valuations and think about saying “good buy”. Albeit also noting in passing, and maybe it’s different this time, but that history tells us for this sector that you do need a degree of patience when the hype-cycle bubble bursts.
Key point: Global renewable energy sector equities are cheap again.
n.b. Check out the full archives of the Chart Of The Week for more charts.
Aside from the Chart Of The Week, this email gives you a brief overview of what was covered in our latest Weekly Insights Report (this email provides a free preview of the Topdown Charts entry-level service on Substack).
Topics covered in the latest Weekly Insights Report
Aside from the chart above, we looked at a bunch of other charts across some important and interesting macro/asset allocation issues:
US Dollar Outlook: where-to next after the rebound
Global Policy Pulse: a pivot in interest rates is on the horizon
Value vs Growth: checking in on the case for value (US + Global)
Defensive Value: why this unusual defensive asset looks attractive
Renewable Energy Stocks: undervalued + unloved as bubble bursts
Subscribe now to get instant access to the report so you can check out the details around these themes, as well as gaining access to the full archive of reports.
For more details on the service check out this recent post which highlights:
a. What you Get with the service;
b. the Performance of the service (results of ideas and TAA); and
c. What our Clients say about it.
Thanks for your interest. Feedback and thoughts welcome.
Sincerely,
Callum Thomas
Head of Research and Founder at Topdown Charts
Follow me on Twitter
Connect on LinkedIn


