Chart of the Week - The Trouble With Cyclicals vs Defensives
Two key issues are on my mind when it comes to cyclicals vs defensives...
There are two important issues here for investors to understand.
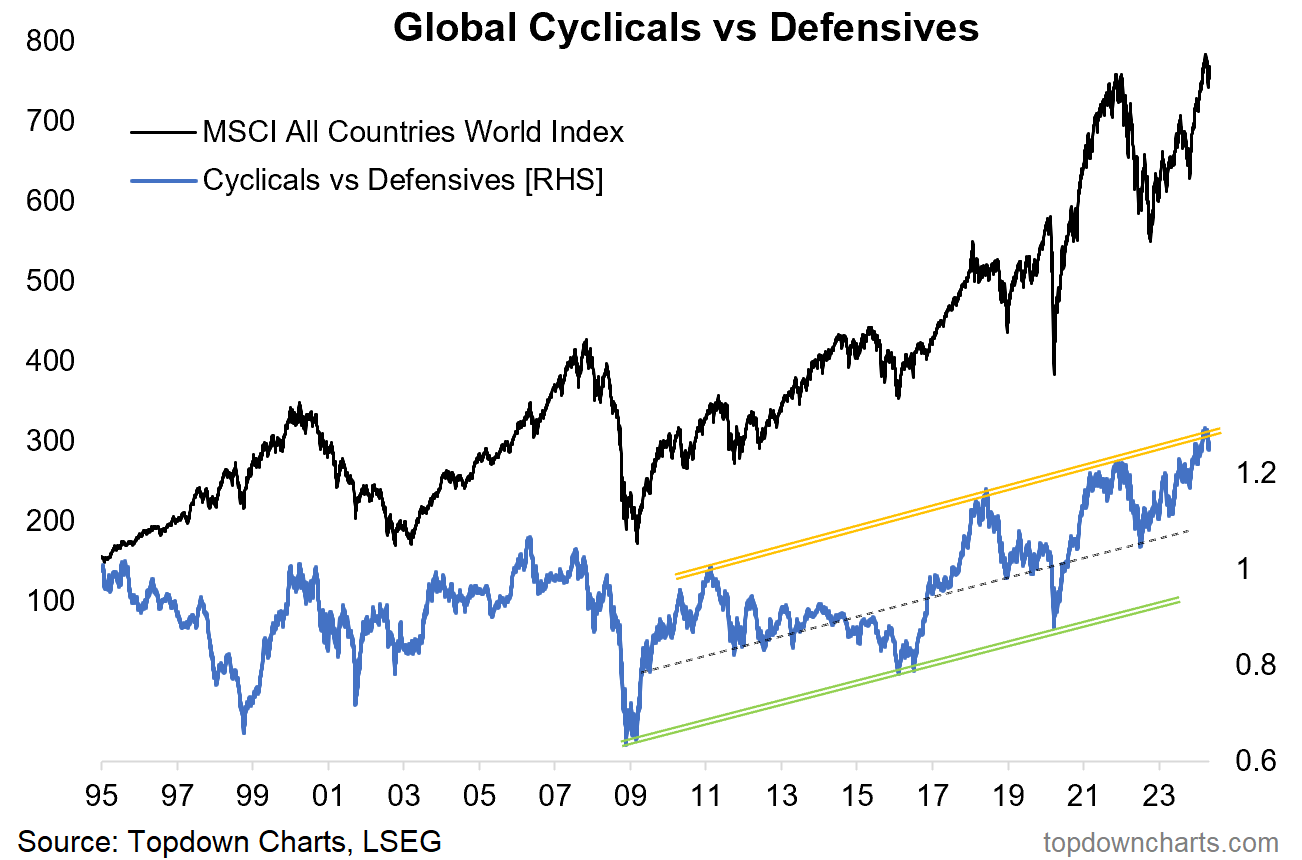
First: the global cyclicals vs defensives relative performance line recently capped out at the top end of its trend channel — this is something that signaled 3 major market peaks over the past decade.
Hence, for the MSCI All Countries World Index (global equities), a red flag is clearly waving. So definitely step up your focus on risk management (take some time out to think about your plan, triggers, indicator set and framework).
Second… some of you might be thinking, hey hang on — wait a minute, didn’t you just last week go on about the upside in cyclicals??
Yes.
“Old Cyclicals“
See, the chart above uses the traditional cyclicals vs defensives classifications… so on the cyclicals side it is: Information Technology, Consumer Discretionary, Financials, Industrials, Materials, and on the defensives is: Consumer Staples, Healthcare, Utilities, Communication Services (formerly Telecoms). The Tech aspect has been boosting it (yes: overvalued and overhyped big tech).
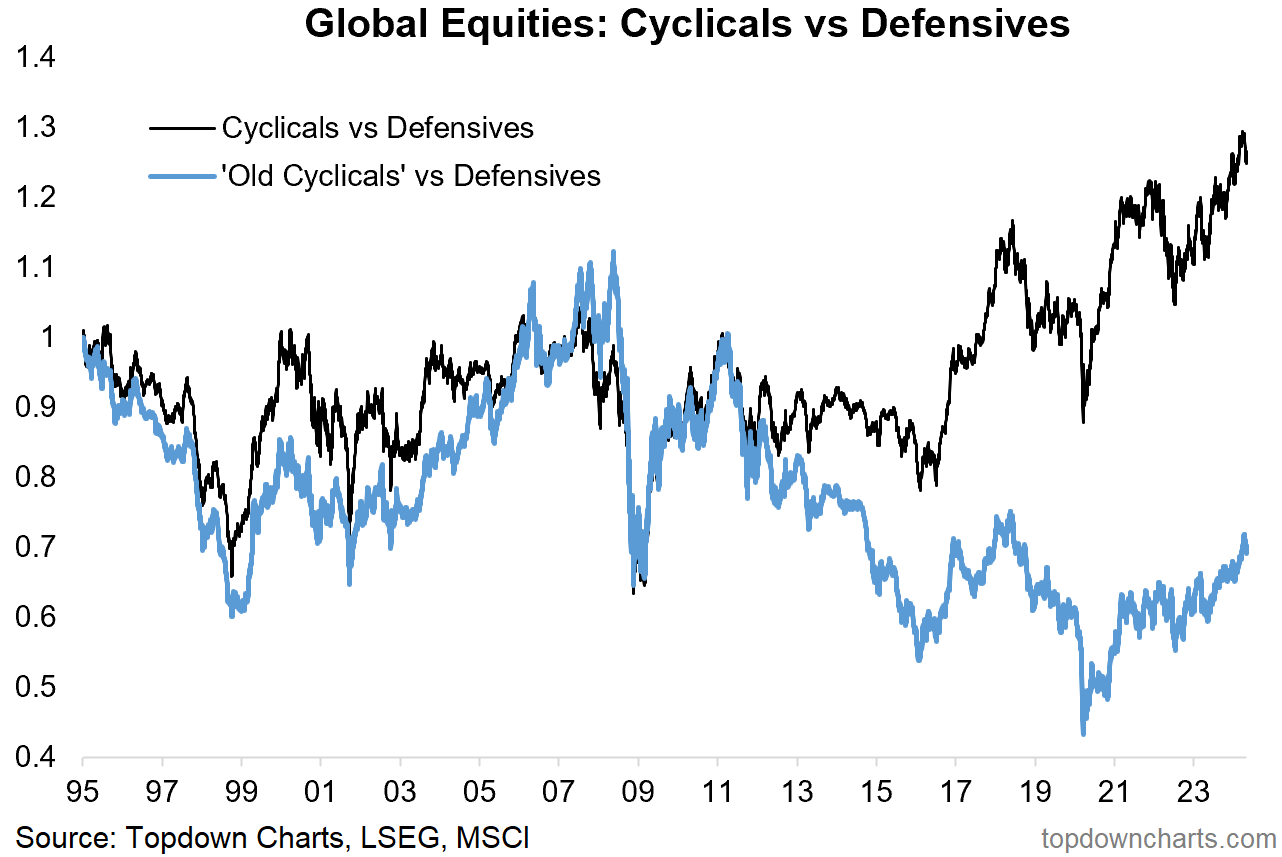
The chart below shows the conventional or traditional definition of cyclicals vs defensives in the black, and the “Old Cyclicals“ (Financials, Industrials, Energy, Materials) relative performance in the blue line.
They are worlds apart.
The stretched move in traditional cyclicals vs defensives says more about the frothiness in tech than anything, but that only serves to cement the risk warning for tech-heavy market-cap-weighted stock indexes (while this chart also reminds us of the opportunity in Old Cyclicals).
Key point(s): So there’s two takeaways this week, first is to be clear and thoughtful about what goes into the indicators you are tracking (e.g. “what do you mean, cyclicals?“), the second is to be mindful of the risk flag waving in global equities from the peak in conventional cyclicals vs defensives.
…and the third is to also highlight the gap (/opportunity) between “Old Cyclicals“ vs what everyone else looks at when they say Cyclicals.
REMINDER: 3-Year Anniversary Special Offer
To celebrate the 3-year anniversary of the Topdown Charts Entry-Level service and as a token of thanks to those who have followed along the way — I have decided to offer a limited-time-only 45% discount for new subscribers (which brings the price back down to levels similar when the service first launched!).
NOTE: offer expires 15th May 2024, discount applies to new subscriptions and is perpetual (meaning the price will not change when you renew in the future), and only applies to the entry-level service.
Topics covered in our latest Weekly Insights Report
Aside from the chart above, we looked at several other charts, and dug into some intriguing global macro & asset allocation issues on our radar:
Global Markets Update: bright spots, mixed spots, weak spots
Emerging Markets: clear picture of emerging strength for EM equities
Chinese Stocks: notable improvement in the technicals (and macro)
Macro Radar: SLOOS, rates, China, and key macro-technicals to monitor
Monthly: reminder to check out the April monthly pack
Subscribe now to get instant access to the report so you can check out the details around these themes, as well as gaining access to the full archive of reports.
For more details on the service *check out this recent post* which highlights:
a. What you Get with the service;
b. the Performance of the service (results of ideas and TAA); and
c. What our Clients say about it.
But if you have any other questions on our services definitely get in touch.
Thanks for your interest. Feedback and thoughts welcome.
Sincerely,
Callum Thomas
Head of Research and Founder at Topdown Charts
Follow me on Twitter
Connect on LinkedIn


