
Chart of the Week - Yet Another Risk Indicator
Leveraged ETF trading volumes show speculative fervor + downside risks

By now you probably know I like putting together all sorts of weird and wacky indicators, and today’s chart is no exception. It takes a kind of non-obvious or less-visible data series and provides some interesting directional signals for the US stockmarket.
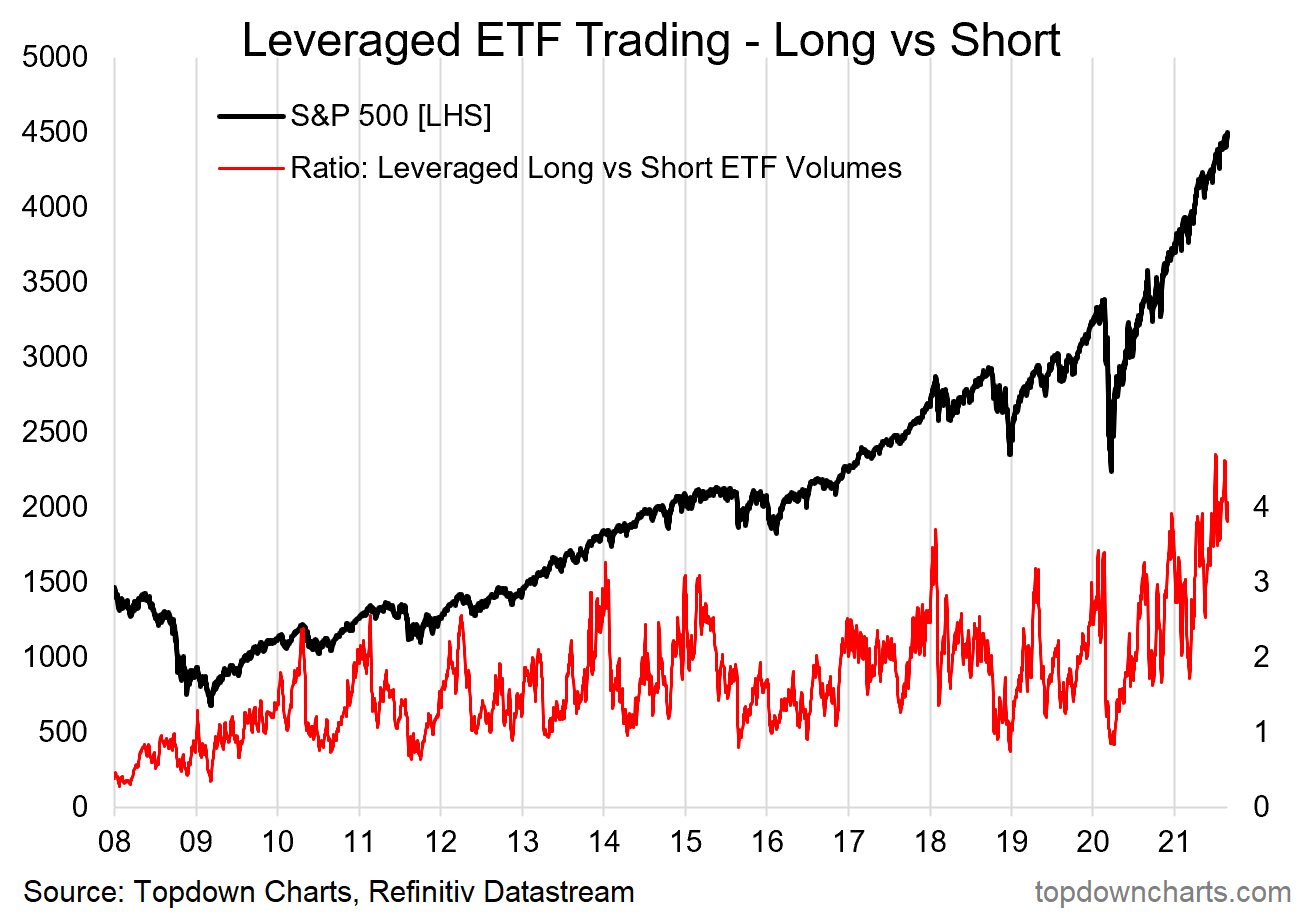
The indicator in question is basically the amount of trading volume in leveraged long US equity ETFs (i.e. 2-3x leveraged bets on the stockmarket), relative to inverse/short ETF trading volumes. In other words the amount of bullish vs bearish bets being placed via the ETF market day by day.
The chart kind of speaks for itself, but as always I find it helps to do just a little bit of speaking to help join the dots.
What we find is that in times (like now) when this indicator spikes significantly (i.e. a sudden rise in bullish vs bearish ETF bets) the risk of a selloff or correction rises. I say risk because it has a decent track record, but like many indicators: not a perfect one.
It’s also worth highlighting that when the indicator collapses it likewise gives a buy signal - these should be standing out fairly obviously in the chart.
So taken by itself: basically this chart is saying there is an increased risk of a selloff or correction. But you know what? Here’s an interesting thing, in the latest Weekly Insights report, I noted how I was seeing a number of risk flags lighting up in global equities, while on my indicators: safe haven FX and defensive equities were starting to look attractive. In other words, this chart is NOT the only risk flag I am seeing.
In other words, we don’t have to take it by itself, because there are a number of other risk flags waving right now. I also highlighted a couple of these in last week’s S&P500 ChartStorm on Twitter (e.g. valuations, macro vs earnings divergences, breadth, and a couple of unusual sentiment indicators).
I’m always cautious when it comes to pounding the table on the bear case too early, particularly when we’re in the middle of an entrenched uptrend and while the monetary taps are on blast-mode. But we are progressing through the cycle, and as a minimum we can fall back on the market aphorism that it daint go up in a straight line…
Bottom Line: The leveraged ETF market is raising a risk flag for markets as traders pile disproportionately into leveraged bullish bets on US equities.
—
Best regards,
Callum Thomas
Founder & Head of Research at Topdown Charts
Sign up to receive the exclusive “Weekly Insights Report" (our entry-level service)