
Monthly Asset Allocation Review - December 2024
Review of markets and succinct guide to risk vs return outlook across asset classes

This email provides a look at some of the key outputs of our Market Cycle Guidebook — giving you a clear snapshot of our thinking on asset allocation.
Specifically, covered in this email is:
Global data pulse, policy monitor, valuation snapshot
Global economy and risk outlook
Core views across asset classes (short + medium term)
Capital market assumptions update (i.e. longer-term)
This email report is aimed at an active asset allocator audience, but should be useful to most investors in terms of providing a big picture perspective on the macro and market outlook.
Monthly Asset Allocation Review - December 2024
Topdown foreword: The key word for December (and really for the full year of 2024) was “mixed” – mixed return experiences, mixed macro, and come to think of it: mixed prospects heading into 2025.
Many folk are looking for a repeat of the 2016/17 bull run in stocks, but as a reminder; 8-years on it’s a sharp contrast to the first coming of Trump; valuations are much higher now, credit spreads are at 17-year lows, sentiment is overcooked, and a puzzling policy path lies ahead.
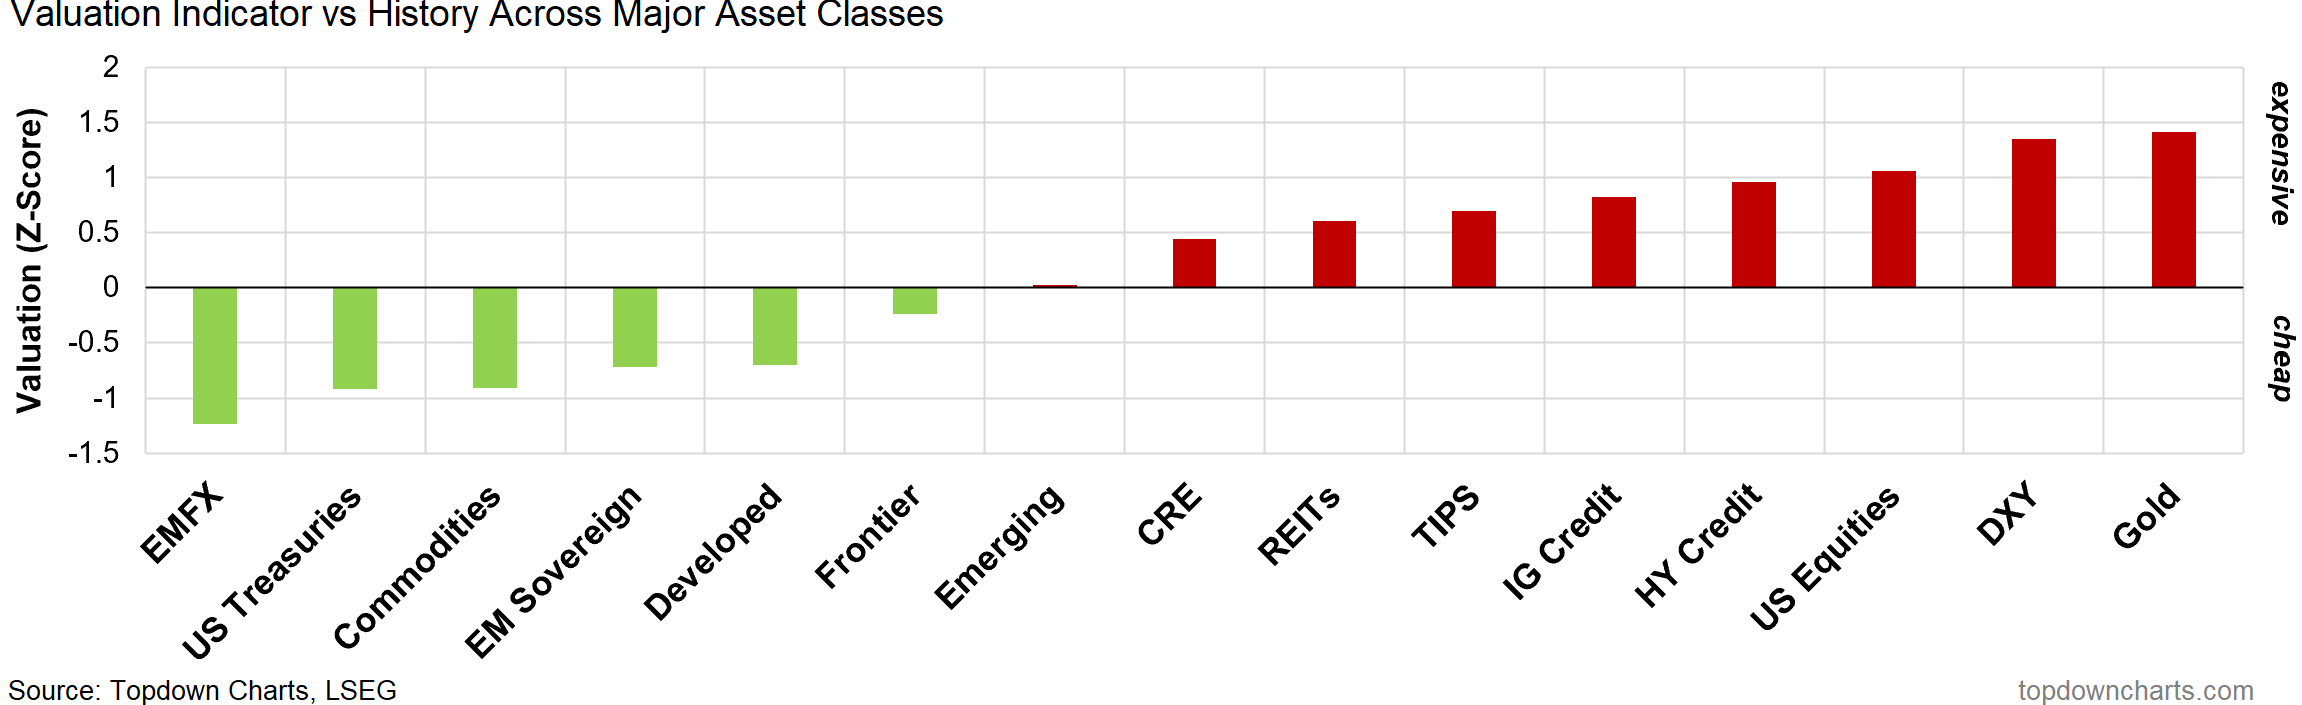
The edge risks of recession vs resurgence are arguably amplified, so it raises the attractiveness of inflation assets like commodities, but also defensives such as bonds (both of which are showing up as cheap).
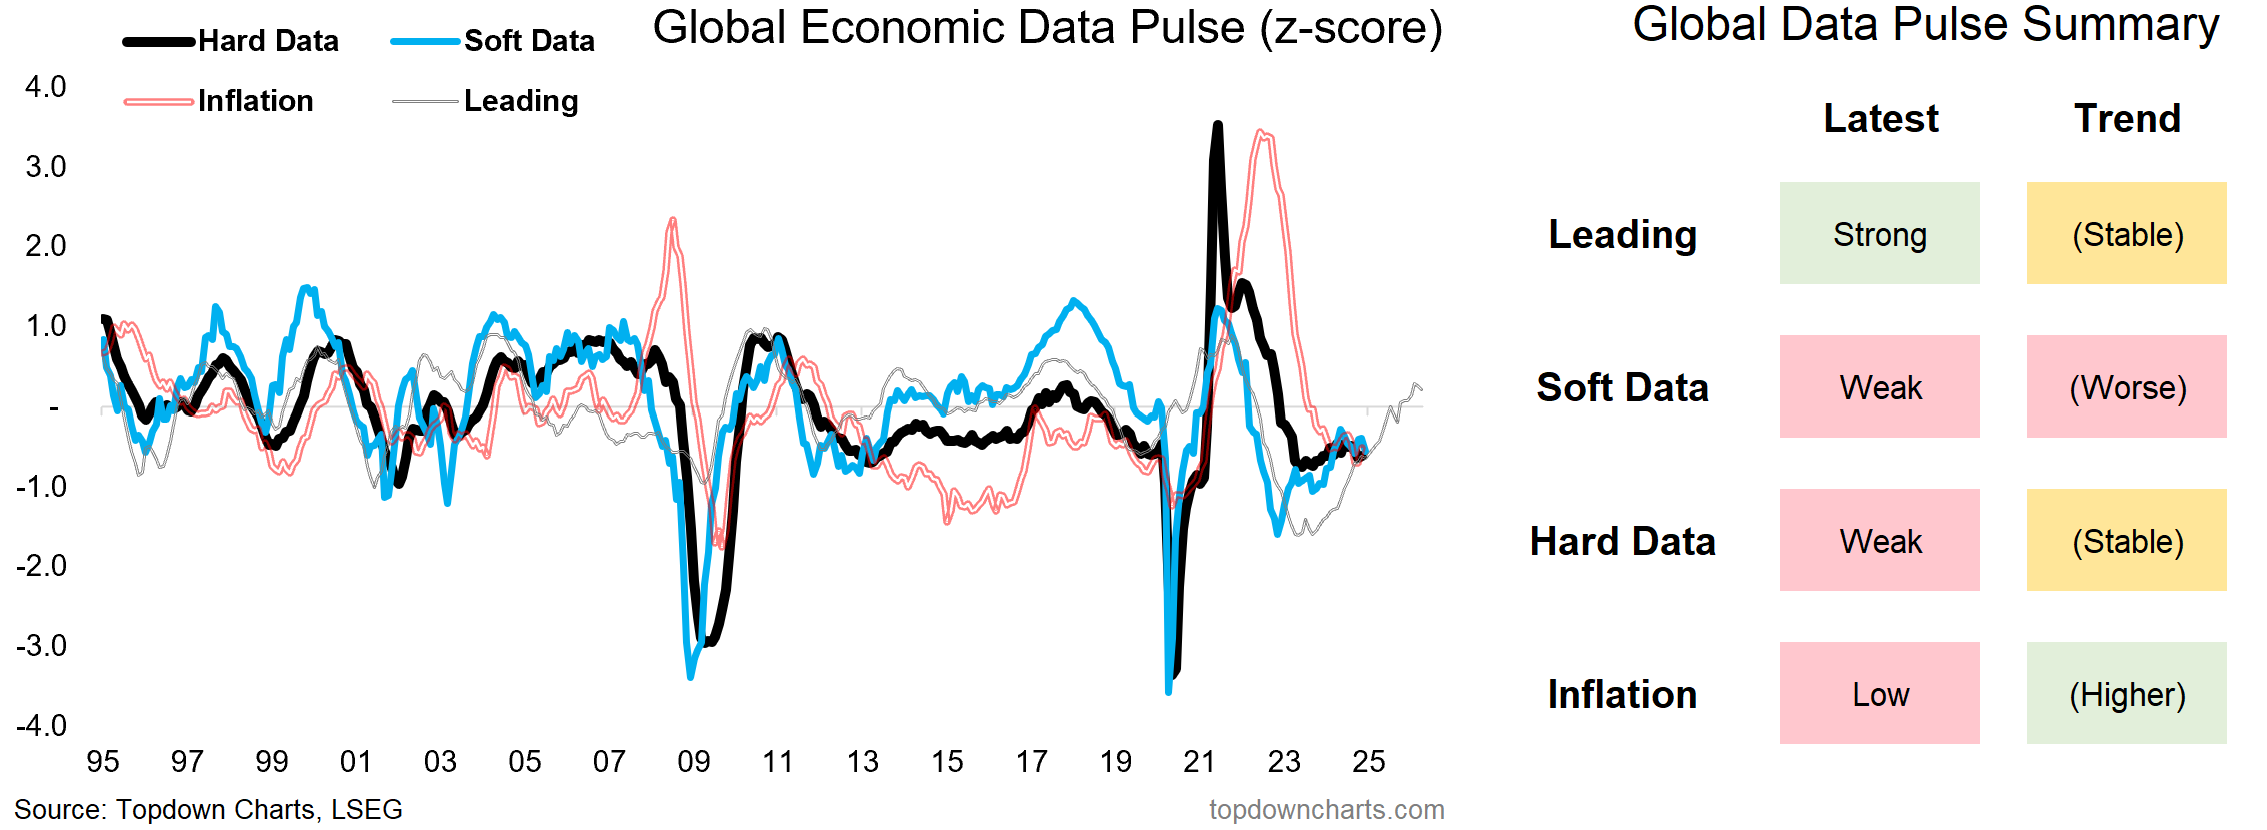
Global Business Cycle Macroscope
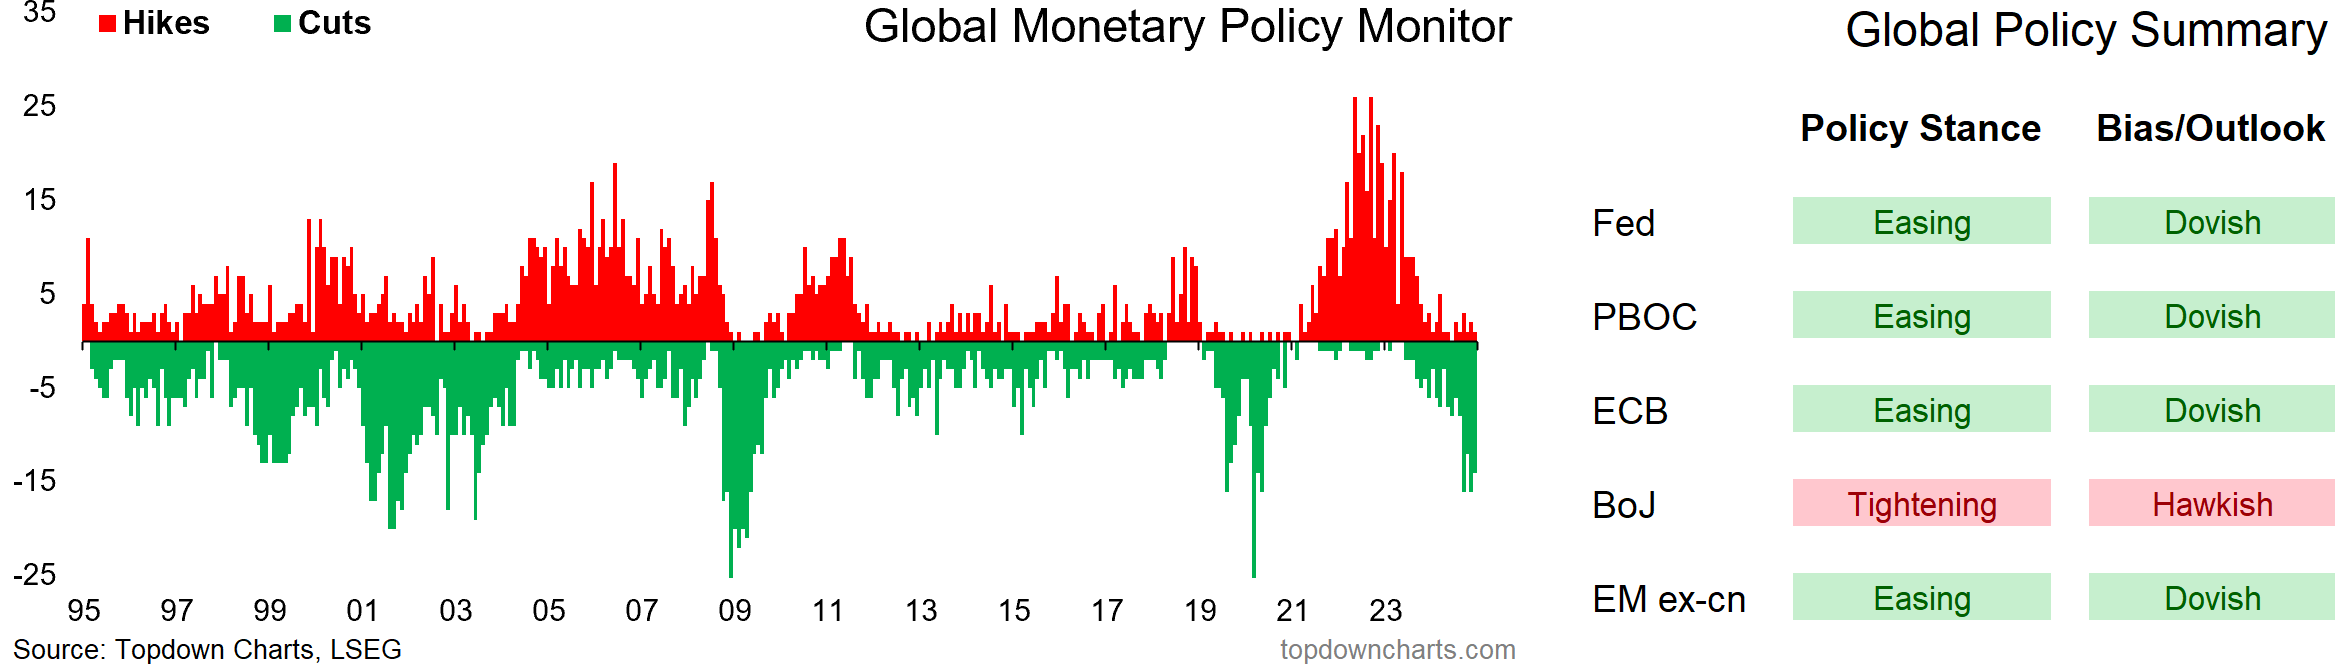
Global Monetary Policy Monitor
Valuation Snapshot
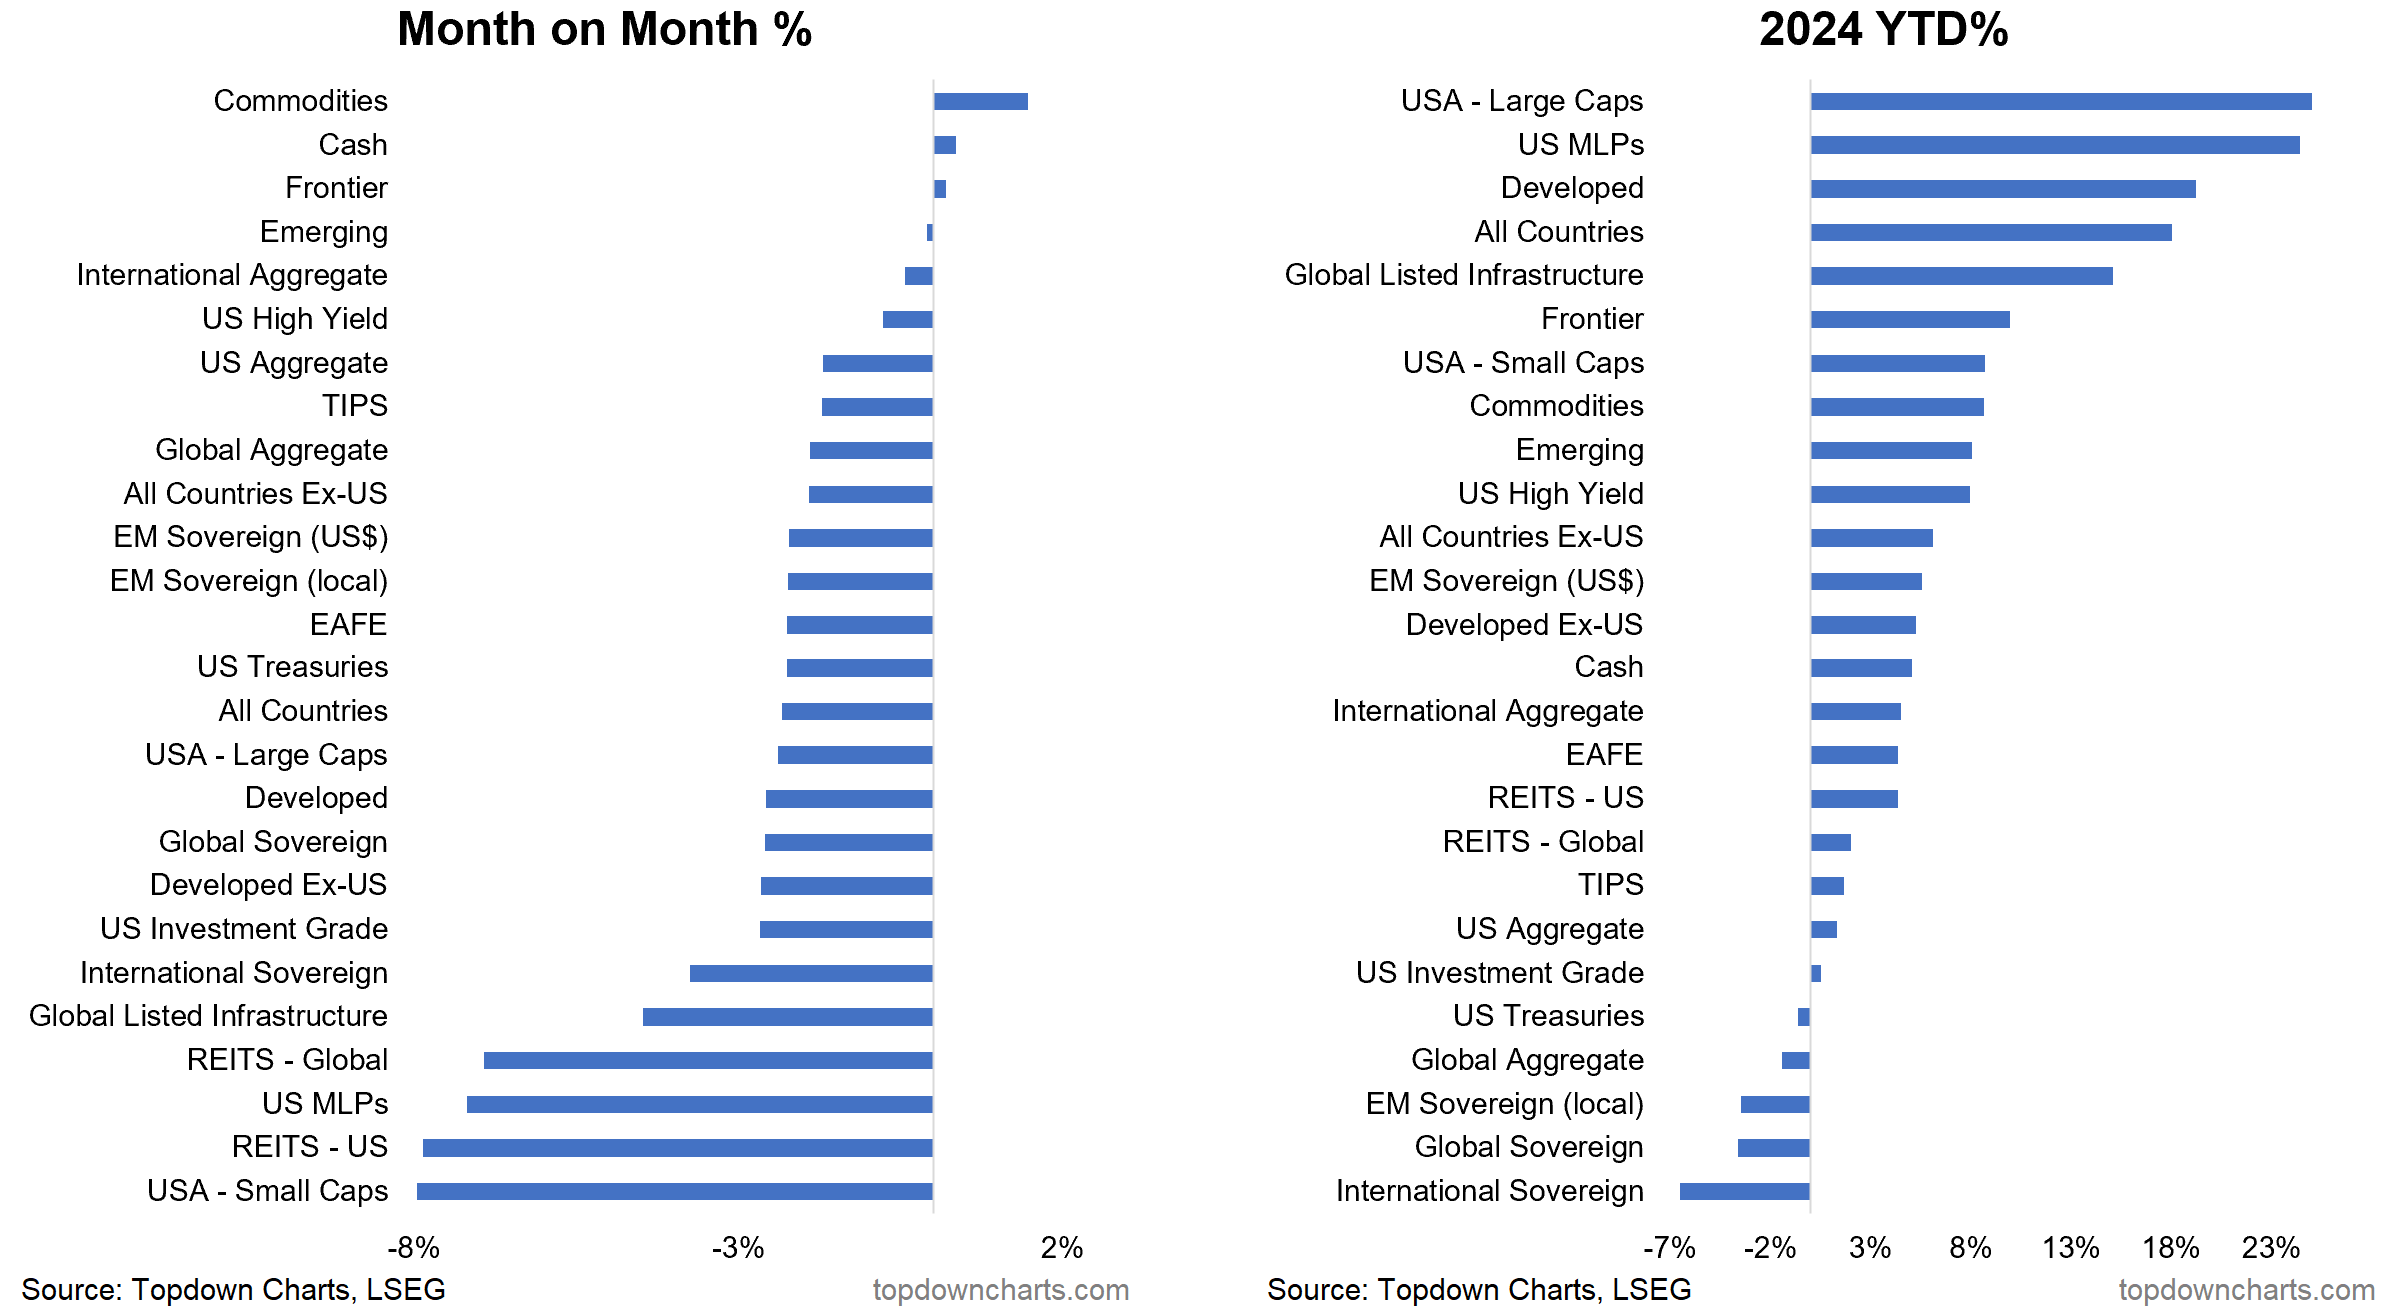
Market Overview -- Month to December: It was a rough end to a mixed year, with both the month and the year seeing quite a mixed return experience across asset classes and regions with clear winners vs losers. Risk assets did respectably in 2024, US large caps led, and bonds were a mixed bag.
Macro Outlook
Global Economic Outlook: For now policy makers appear to be progressing down a path of “policy perfection” with softer but non-recessionary growth, steadily lower inflation, and hence an open door to normalizing policy rates and at least pulling back on previous tightening.
Resurgence risk is low in the immediate term as the initial rebound in growth and inflation has faded, but if monetary easing increases and growth holds up, we could be looking at reacceleration and inflation resurgence as a key theme in 2025.
On the other edge, deflation risk seems less likely in absence of any imminent signs of recession, but as noted previously things can change quickly, there are late-cycle signs, and lingering uncertainty around the long and variable lags of previous monetary tightening.
Risk backdrop: Post-election the macro edge risks (recession vs resurgence) are arguably intensified as the red wave and Trump presidency presents a potentially “very not boring” policy mix. Meanwhile geopolitical risk has become significantly more concerning, with two major conflicts ongoing and risks of spillover/escalation still material.
Upside risks include a pivot in China to more stimulus (seems to be in progress), non-inflationary reacceleration + virtuous rotation, or indeed, the middle path of policy perfection where stocks do OK, bonds range, and short-term rates continue to come down.
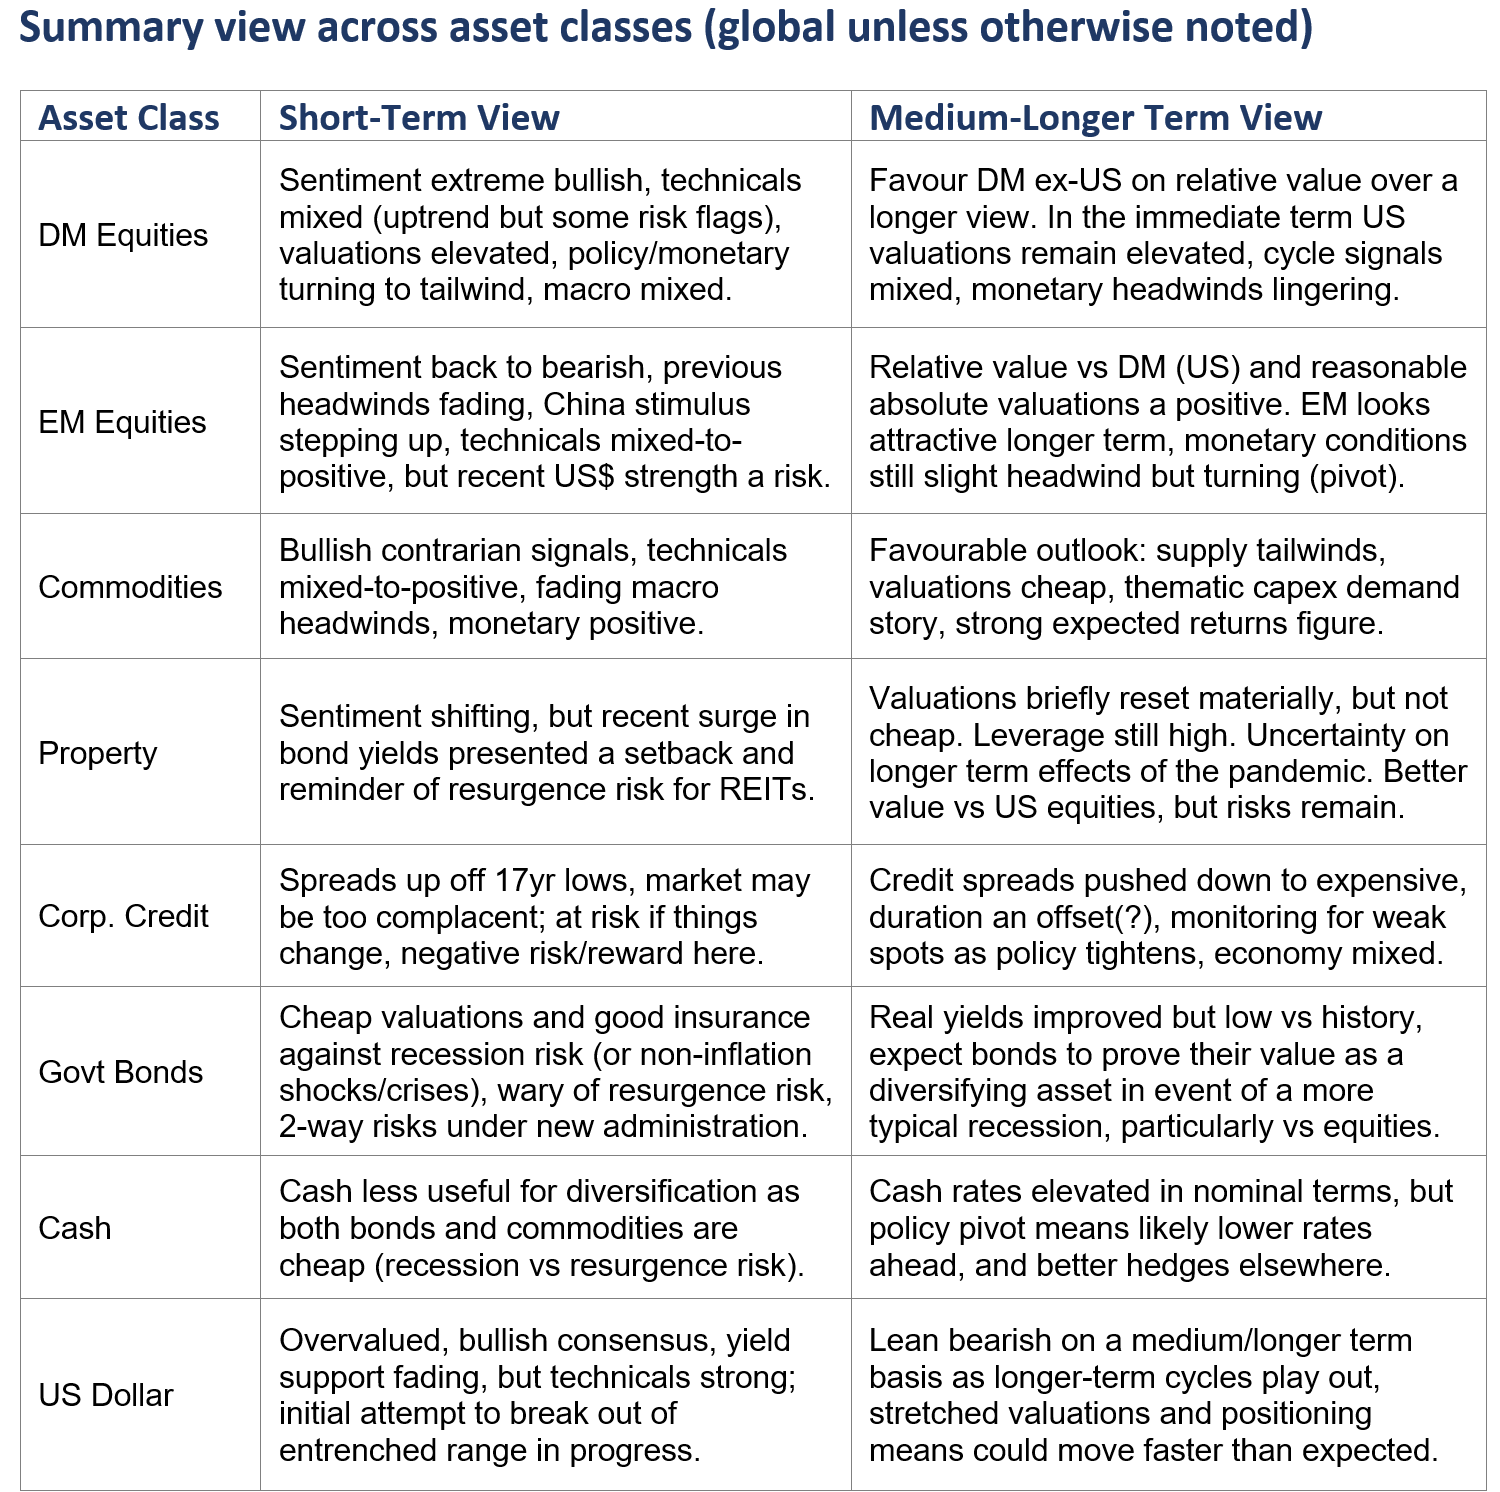
Summary View Across Asset Classes
The below table provides a “cheat-sheet“ summary of our views across the major asset classes. Short-term is typically in the order of months/quarters (less than a year), while medium-term is more a through-the-cycle view (multi-year).
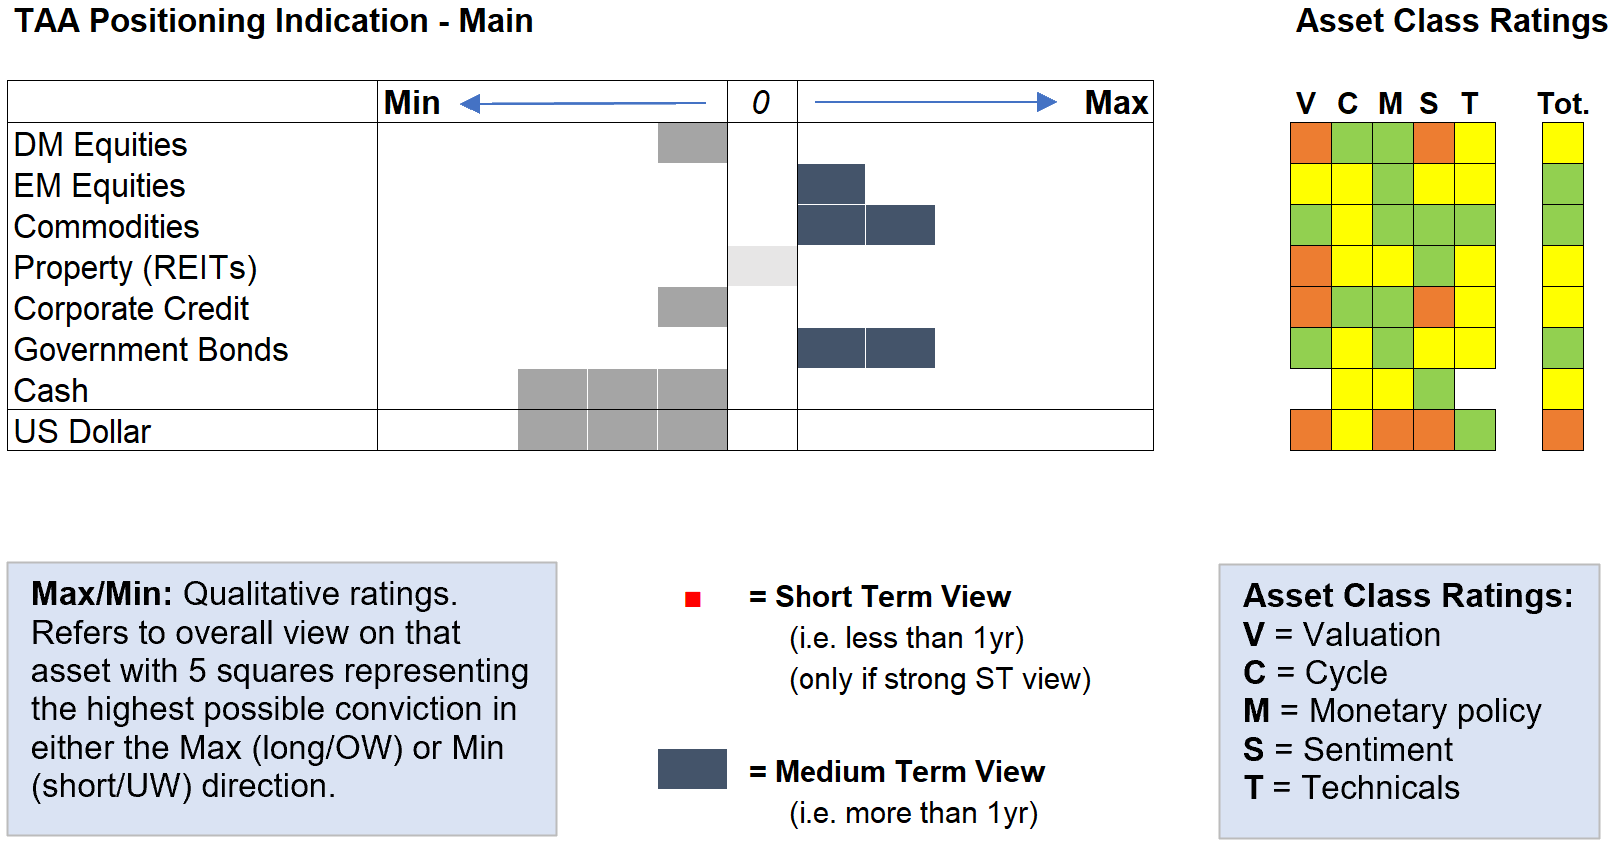
Asset Class Ratings and TAA Guide
As a reminder, we do not manage any money, or provide personal financial advice, nor offer securities. The purpose of the following tables is to provide a high-level positioning indication based on our analysis and indicators across the various asset classes, from an unbiased/generic multi-asset investor perspective. The asset class ratings are quantitatively driven, but judgement is applied.
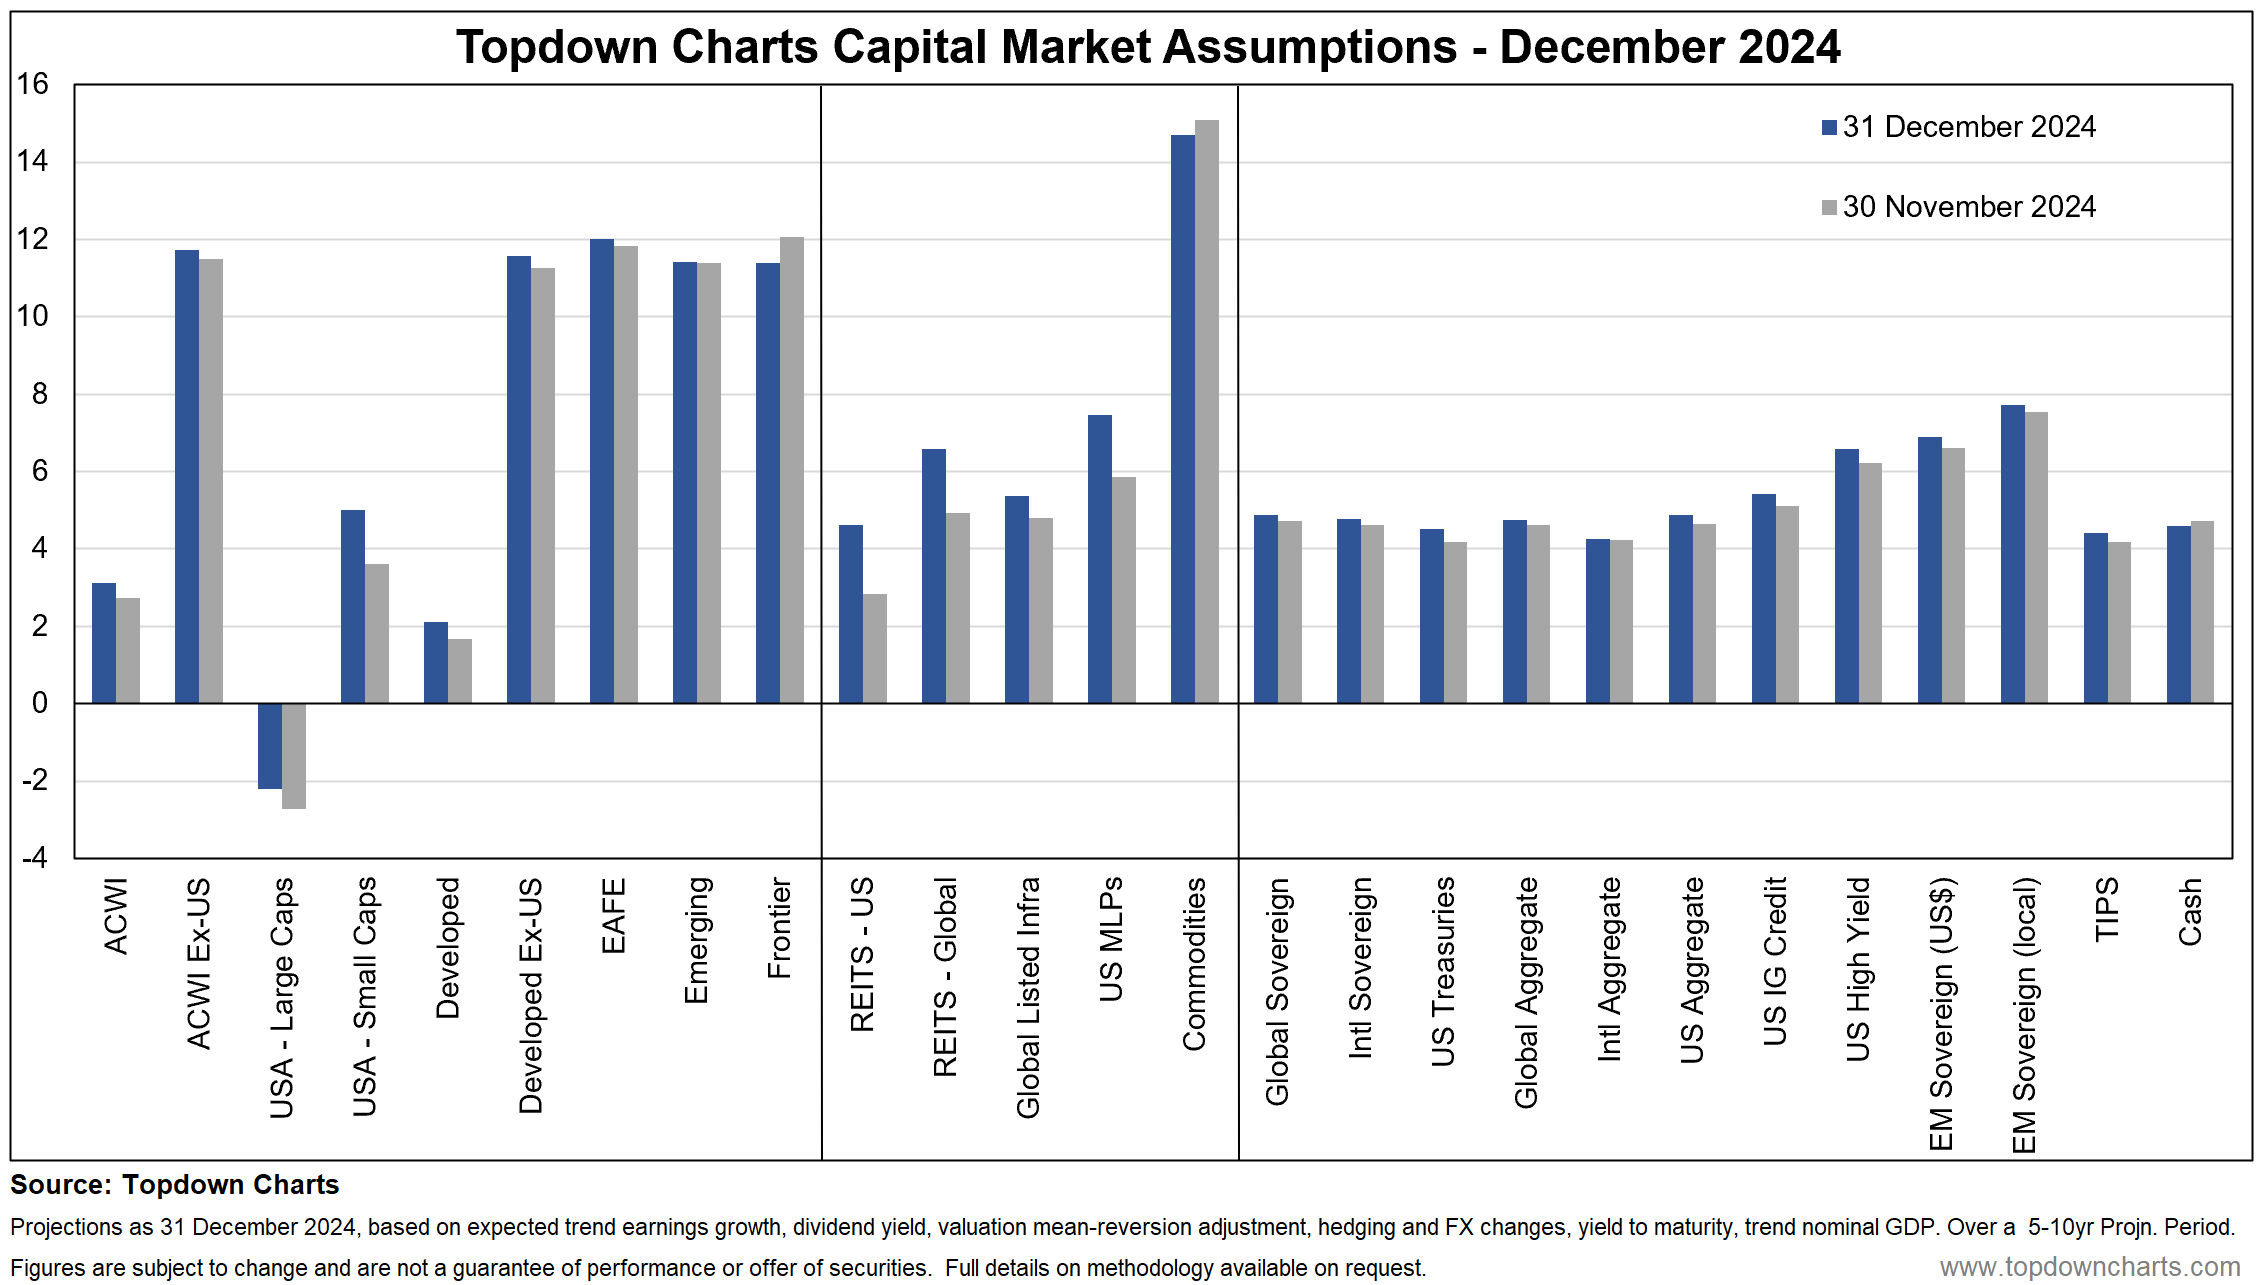
Capital Market Assumptions (Long-Term View)
The following is an extract from our capital market assumptions dataset. These represent a 5-10 Year forecast based largely on quantitative inputs. They are presented in nominal terms, on an annualized basis, and are stated from the perspective of a US dollar denominated investor.
December Update: Expected returns rose across most asset classes as higher bond yields pushed stock prices lower (and hence increased dividend yields and lowered valuations); especially so for REITs and small caps.
Over the longer horizon, the data suggest the best returns are likely to come from what has traditionally been considered the riskier end of the spectrum given the moves in valuations and where things sit on the yield front (i.e. global ex-US equities, EM, frontier, commodities, EM debt, high yield credit).
This is almost the opposite of the consensus and where most flows are going (performance chasing — an assumption that what worked in the past will continue to work ad infinitum). That said, it must be noted these are longer-term perspectives.
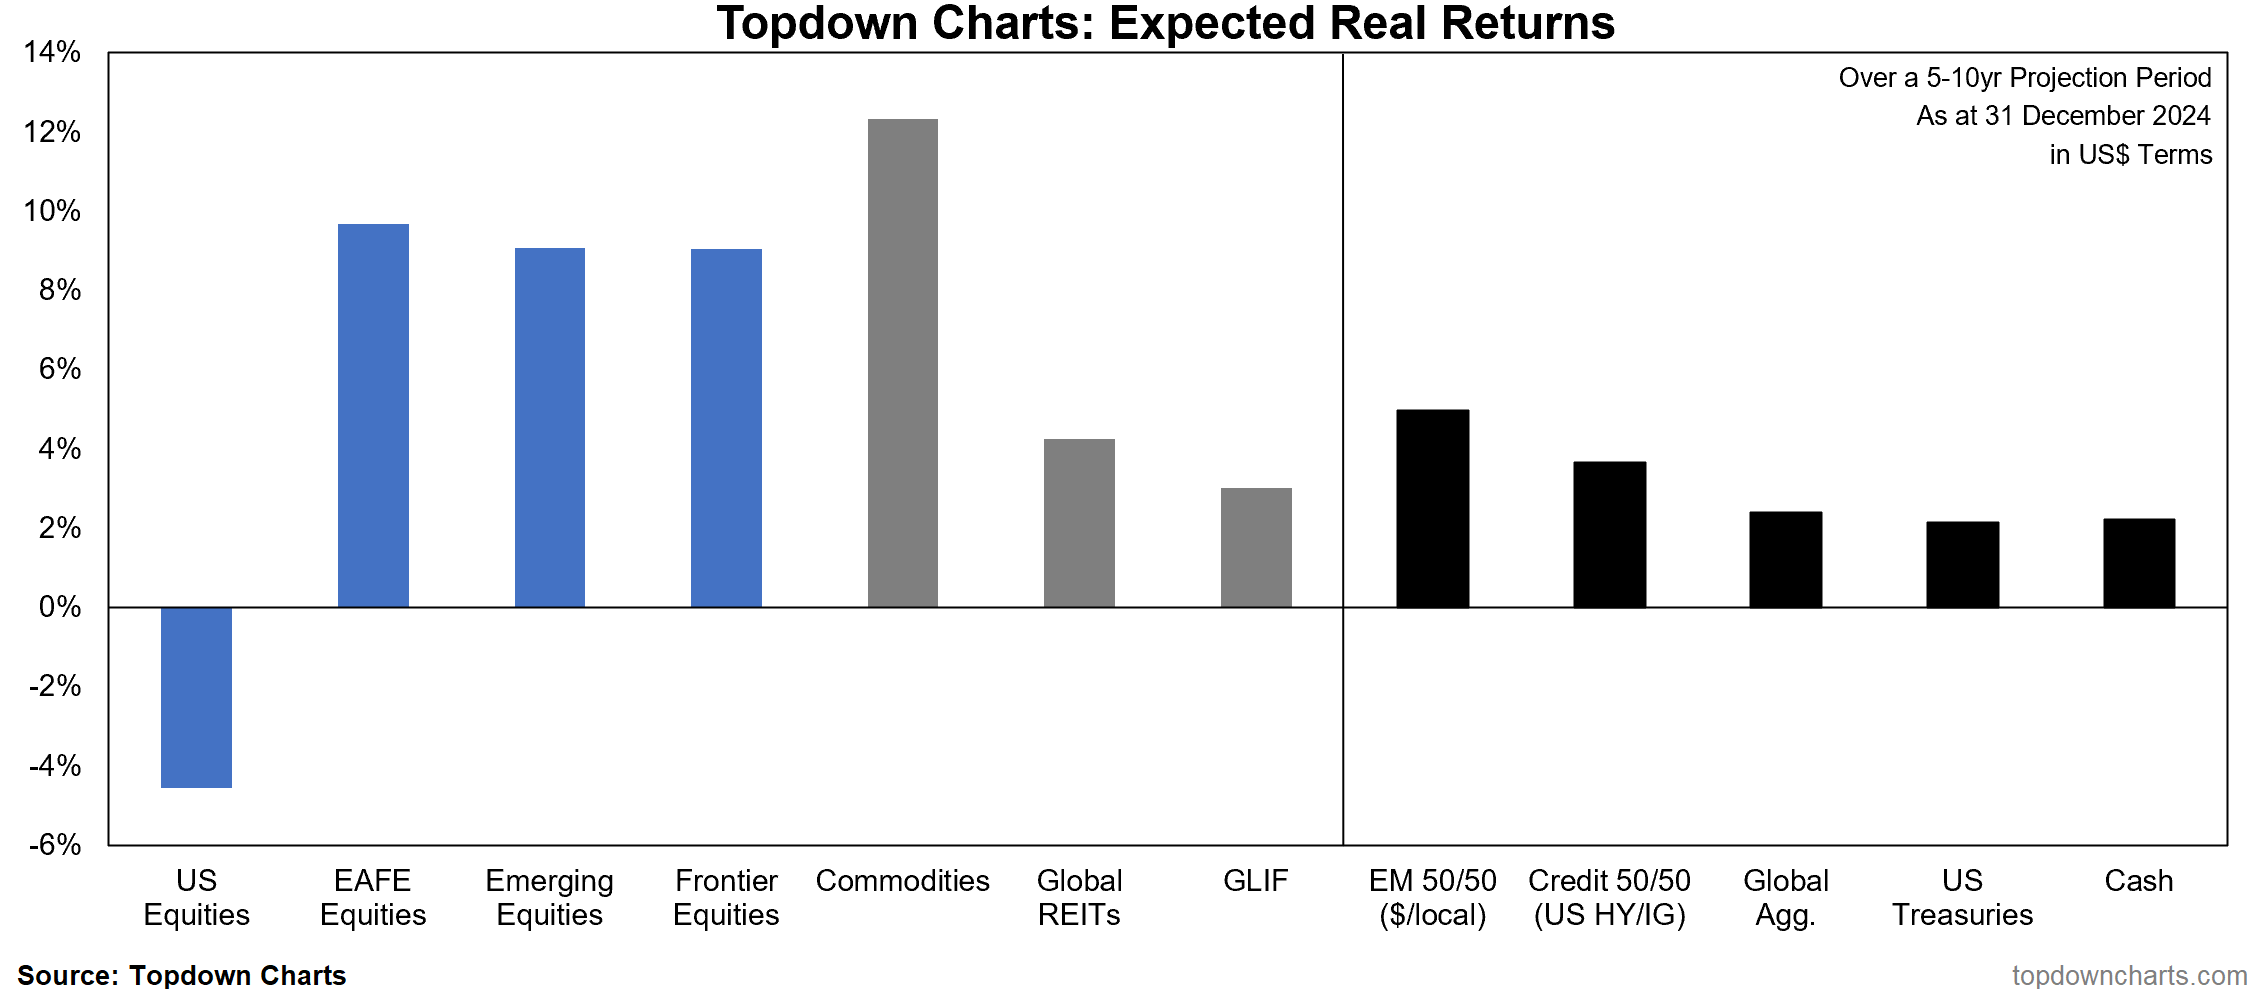
Supplemental chart — Expected *Real* Return Summary (inflation adjusted using US long-term expected inflation).
If you haven’t already, be sure to subscribe to this paid service so that you can receive these reports ongoing (along with full access to the archives and Q&A).
Alternatively, if you are already a happy paying subscriber, why not consider the option of gifting a subscription to a friend/colleague/client/family member using the button below?
Thanks for your interest. Feedback and thoughts welcome in the comments below.
Sincerely,
Callum Thomas
Head of Research and Founder at Topdown Charts
Follow me on Twitter or Bluesky
Connect on LinkedIn