Track Record
I had some questions, so here's some answers...
I had a question in the comments about whether I have a model portfolio or some sort of track record. Which is, for those who don’t know me or who aren’t familiar with my work, basically another way of saying: “why should I trust you?“
To be honest I’m that self-effacing that I would say you probably shouldn’t! I’m half joking- but also half-not, of course, you never want to fully rely on one person/source/indicator.
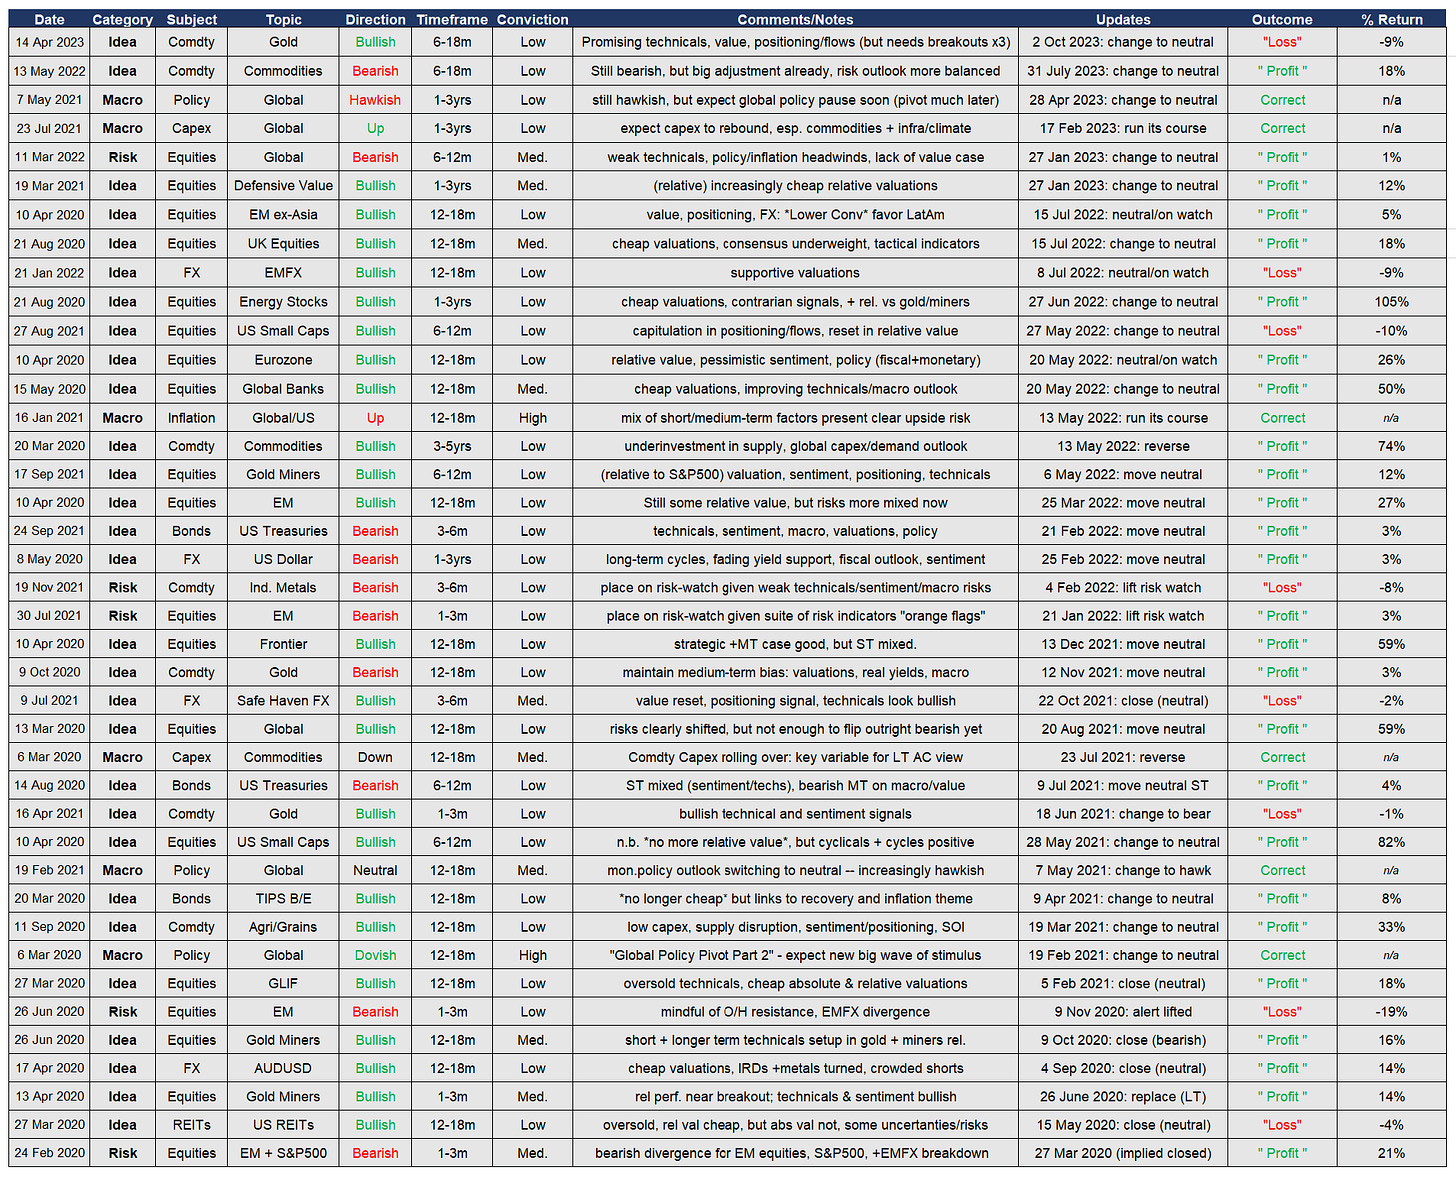
But to get to the point: I don’t have a model portfolio, but I have the next best thing to it, which is an inventory of ideas where an explicit view has been put forward. I also have the tactical asset allocation guide in the Monthly Asset Allocation Review (see below for performance stats on that).
Here is an example of the ideas inventory:
[BY THE WAY: the weekly updated table is included in the Weekly Insights report — subscribe to see the latest live ideas and analysis updated]
I am careful to call it the “ideas inventory“, because you can’t really call it a model portfolio - that would require a layer of portfolio construction (e.g. how the ideas fit together, correlations, certain constraints, benchmark, etc) and ongoing risk management within the constraints of the portfolio objectives and stakeholders and so on and so forth.
In other words, I am a professional researcher. I basically made the choice to go down the research path rather than the portfolio management path. I might go down the portfolio management path later in life, who knows, but I do know from my time in manager research that portfolio management is an entirely different skillset from research and I would say portfolio management has at least a 5-10 year runway to begin consistently performing at a professional level.
To that end, it is also a good point to highlight that I do not trade myself (my personal “investment“ portfolio is basically a house and a research firm - not very good diversification I know). Some would say that means my research isn’t worth anything because I don’t have any “skin in the game”.
Two problems with that:
Skin in the game can be good, but can also significantly distort and cloud the research process - even at an unconscious level you can end up skewing or swaying the reader round to your wedded self-interested positions in the market. You’d be surprised.
Independence matters: as a research professional I want nothing messing with my independence (so I don’t trade, don’t sell securities or funds, and have no external shareholders or ties to any other firms).
(..and) I DO have skin in the game: if my research sucks, my clients will fire me and I will struggle to get any new business - for the sake of my family, my mortgage, and frankly also to a certain extent: my ego — I have a massive interest in doing my very best work each and every day, and striving to innovate and add value in what is a very competitive space.
This probably goes some way to answering the question, but at the end of the day if you’re not convinced, if you don’t trust my work, then don’t sign up. It’s not for everyone, and if you’re not on board then you’ll probably end up ignoring or dismissing my findings at the worst possible time. Of course you are also welcome to subscribe on a monthly basis to test it out and terminate at will.
IMPORTANT: Research Process & Philosophy <— that article provides an overview of how I approach macro/markets, and core beliefs. Again, I believe this part is important in understanding how I actually go about things, which is probably just as important in building trust as a hard track record is.
But before I leave you, the above table is the “live“ or current/open ideas, the below table shows the closed ideas - i.e. those where the view changed, or the initial idea ran out of time or came full circle (this is the record part of the track record!):
Hope this is helpful - comments/questions welcome.
ADDENDUM — END OF YEAR SPECIAL REPORTS
At the end of each year I go through my charts and calls of the year that was and list what worked, what didn’t work, and my favorite charts… this is also a good window into my work and where I have got things right/wrong in the past. By now I’ve accumulated 6 of these reports, so truly a market cycle tested service.
(p.s. where does the time go??)
End of Year Special Reports [Best/Worst/Fav charts — basically a report card]:
2023 | 2022 | 2021 | 2020 | 2019 | 2018 | 2017
(click the years above for the corresponding report PDF download link)
ADDENDUM — MODEL TAA POSITIONING
The below chart shows performance of the TAA model in the Monthly Report. It maps min/max positions onto a scale of 1% to 5% under/over-weight (in practice positions might be larger, particularly when conviction is higher). Calculations are on a total return basis, excluding fees/expenses/tax etc. Also, as always, past performance is no guarantee of future performance. Updated to 31 Dec 2023.
Best regards,
Callum Thomas
Head of Research & Founder at Topdown Charts
Twitter: https://twitter.com/Callum_Thomas
LinkedIn: https://www.linkedin.com/in/callum-thomas-4990063/


p.s. you can now access our full service (the full reports in all their glorious detail) -- click here to compare the full service vs entry-level service: https://www.topdowncharts.pro/about