Weekly Insights - Edition 184
This week: market update, emerging markets + China, global policy pulse, resurgence + reacceleration risk, bond yield outlook, comparing the setup in 2016 vs 2024...
Welcome to the Weekly Insights report! The weekly insights report presents some of the key findings from our institutional research service, providing an entrée experience (in terms of price and size).
Global Markets Monitor - notable developments
Last week saw US markets rally notably, while Europe and Asia did not share the same enthusiasm (partly due to trade war 2.0 risk, but also a stronger US dollar). Within the US the strength was seen at both ends, with small caps and tech stocks alike rallying sharply post-election.
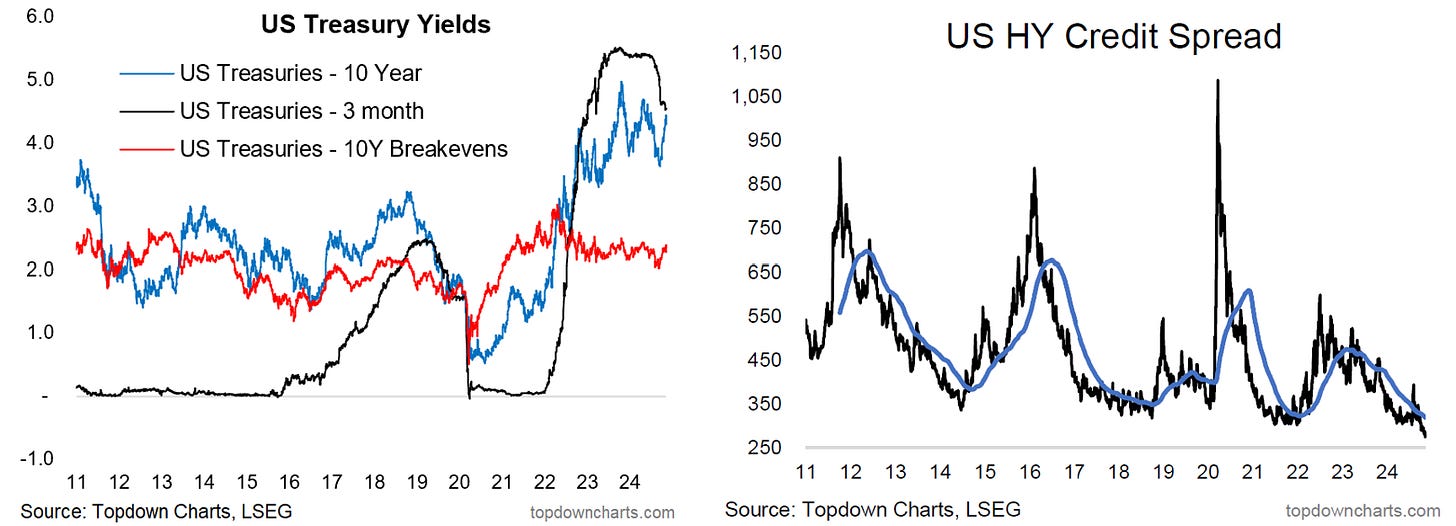
US 10-year yields also spiked notably into the election result, but have since pulled back from the highs. Short-term rates moved lower as the Fed delivered another rate cut. Elsewhere, credit spreads continued to make new lows as risk-on sentiment also shined on credit markets.
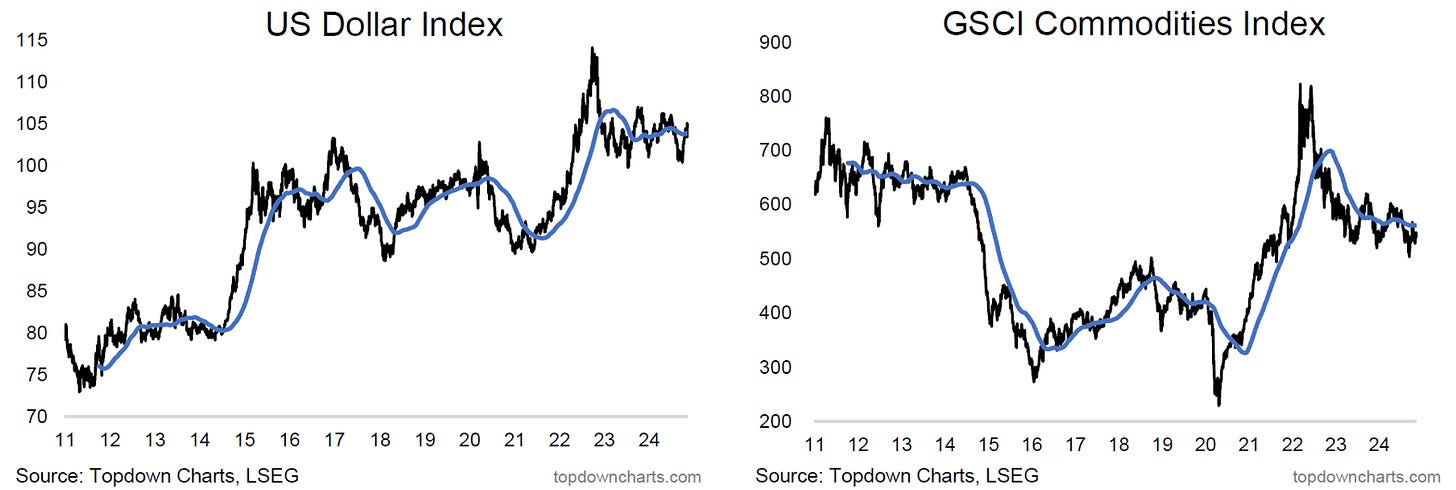
In FX, as noted the US dollar saw further strength into and post-election, while Asian/EMFX weakened notably. Commodities remain a mixed bag, the index holding onto support (likewise for crude oil), gold pulling back somewhat, industrial metals ranging, and agri mixed-to-weaker.
Market themes: Zooming out and in on Emerging Markets...
-Despite the mixed trading in EM last week, the bullish medium-term technical prognosis stands.
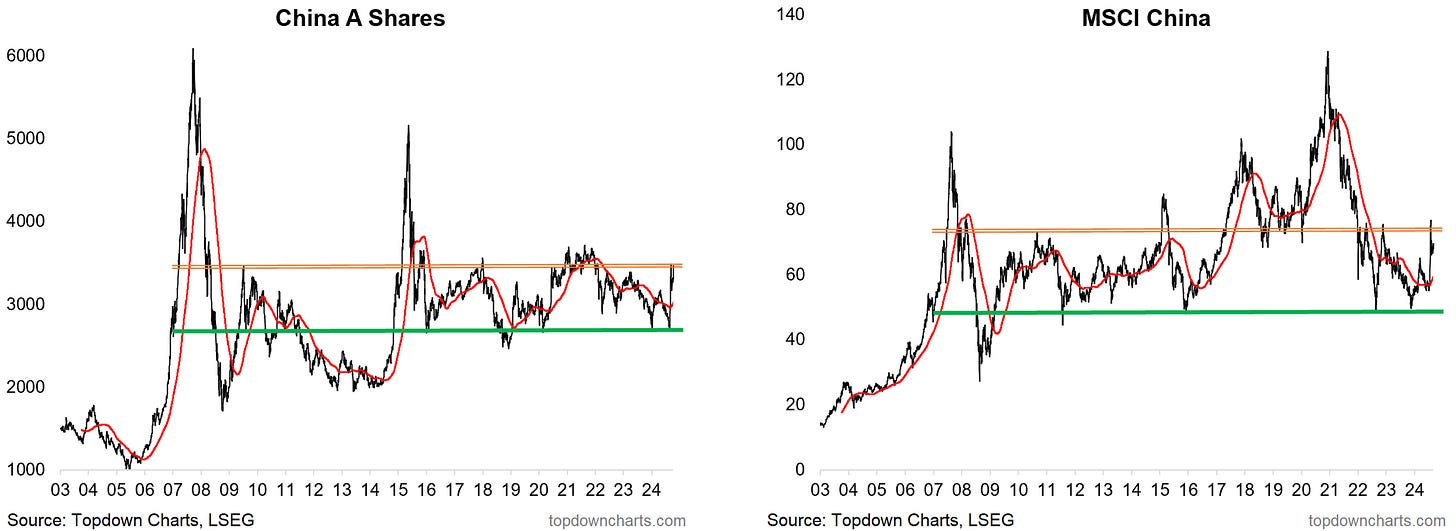
-Chinese stocks are making further gains, and are pushing up against a major overhead resistance level.
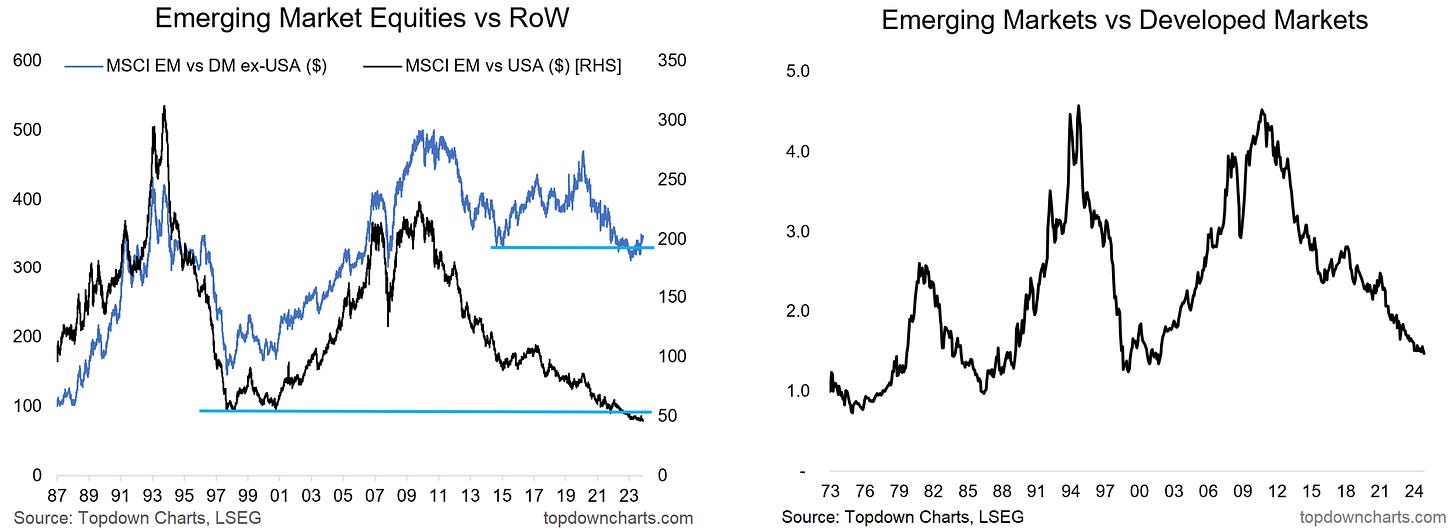
-On a relative basis, EM is making ground vs DM ex-US, but still struggling to turn the corner vs US stocks.
Zooming out and in on emerging markets, it was very volatile trading last week as markets struggle to make up their mind on the implications of a second Trump presidency and what it might mean for the array of macro and (geo)political factors that impact EM such as the US dollar, commodity prices, global trade, tariff risk, Fed rate cuts, China stimulus, to name a few. But bigger picture, the big breakout in Emerging Markets ex-China is still in play, and the MSCI emerging markets index in local currency terms remains in cyclical bull market mode; following it's long-term uptrend line.
As for China, the stimulus scales keep tipping, with further details on stimulus announced, and paradoxically tariff risk potentially giving some boost to stocks via the bad news is good news channel in that it would raise the odds of domestic stimulus (not to mention the 3-d chess aspect where possible US tariffs on Europe could sway them to deal more with China; who may even form a trade alliance with those left out cold by the US; all hypothetical of course for now). In the immediate term looking only at the technical charts, China A-shares look good; the breakout vs 200dma as stuck, and the index is making another move on that major overhead resistance zone.
As for emerging markets vs the rest of the world, EM does seem to have turned the corner vs DM ex-US, but is still up against a high and moving hurdle set by the US. Looking at the longer-term chart the big cycle looks more due than ever to turn, but history does show that when it does turn the corner, it can be a multi-year work in progress.
An important chart nonetheless, and a prompt to consider what might be vs what has been.
On the Radar
Macro & Markets: This week we get M2/ new loans, activity data, house prices from China, and from the US we get the NFIB, Fed loan officer survey, CPI/PPI, retail sales, and also a speech from Fed Chair Powell.
In markets, US the 10yr yield is pulling back from the post-election highs, DXY holding gains post-breakout, gold finding support after post-election pullback, crude hugging support, Bitcoin blasting off, and US stocks apparently stronger for longer...
Research Agenda: This week I’ll be looking at US dollar and emerging markets, housing markets, small caps, and gold/commodities.
Weekly Macro Themes Report - key points
1. Monetary Policy Pulse: policy pivot puzzles…
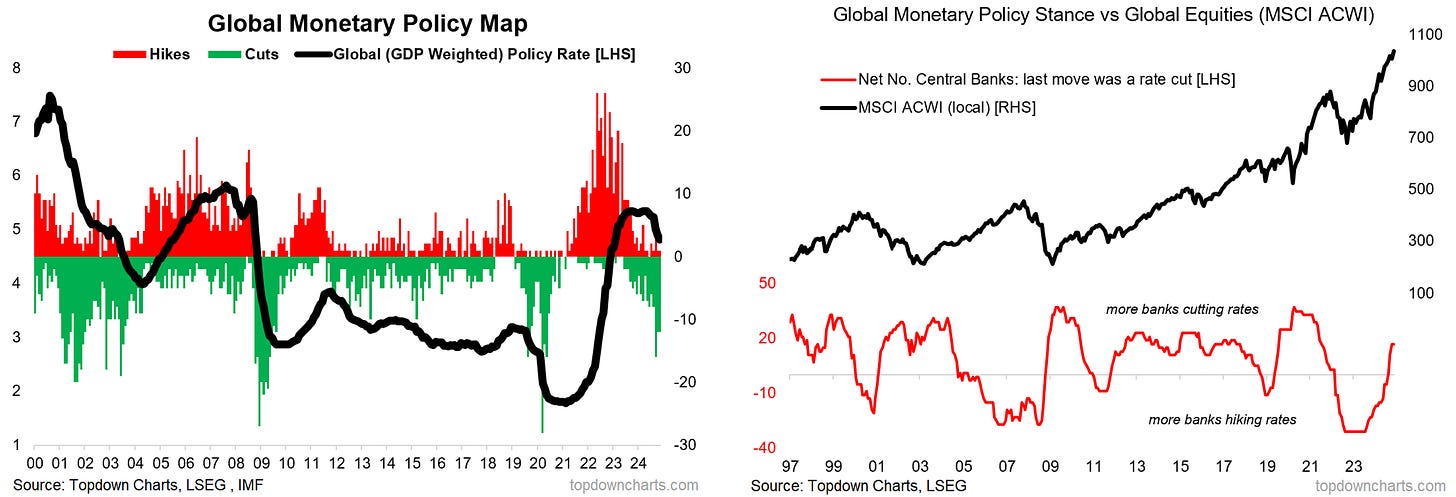
The global policy pivot to rate cuts is gathering further steam in November, with the breadth and pace of rate cuts matching similar to that seen in the past 3 major global rate cutting cycles (only this time there’s no crisis/recession to deal with(yet)).
Given the thus far absence of crisis/recession, the global pivot to rate cuts has given a boost to global equities; helping extend the cyclical bull market.
One sub-theme to this would be the unmentionable un-pivot. Brazil is thus far serving as a case study and potential near future scenario for the Fed (it pivoted to rate cuts in 2023, and then back to rate hikes in September this year).
Past instances of short rate cutting cycles by the Fed featured relatively decent performance for stocks, and bad for bonds as bond yields tended to move higher (which probably makes sense as a move back to hikes probably would feature higher nominal growth).
Bottom line: The pace and breadth of interest rate cuts globally is on par with the past 3 major global rate cutting cycles, however this time there’s no crisis/recession to deal with.
2. Reacceleration: growth reacceleration prospects…
The global monetary policy pivot to rate cuts takes away previous growth headwinds, and will increasingly add growth tailwinds (and boost confidence/stocks).
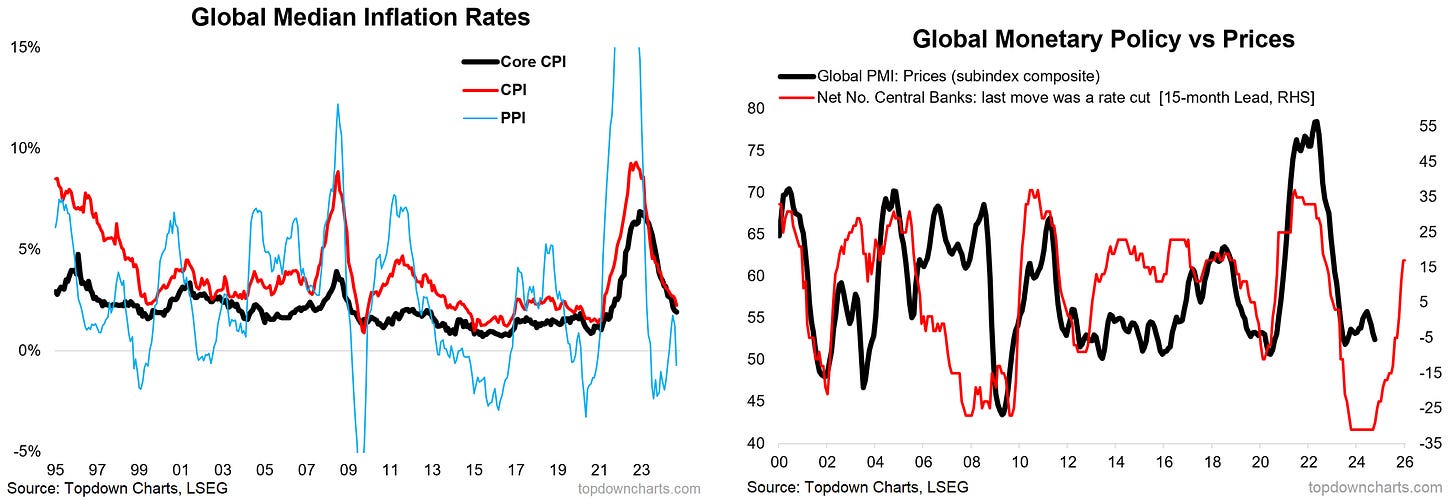
We see a similar message across the leading indicators, with the general trend being that of getting less bad, and increasingly reacceleration signals. For example, the cost-related leading indicators are pointing to growth reacceleration into 2025 as easing cost pressures impart a growth tailwind.
Looking at the global cycle map, heading into 2025: as noted, the leading indicators are improving, the soft data is getting less bad (albeit stop/start), hard data growth rates also getting less bad (albeit slow progress), and for now disinflation continuing to run its course (which may soon change).
Bottom line: The progressive global policy pivot raises the odds of global growth reacceleration risk, with numerous leading indicators pointing to improvement into 2025.
3. Resurgence: inflation resurgence risk…
Signs of potential inflation resurgence earlier this year came and went, and disinflation remained the main trend globally, which of course opened the door to monetary easing.
That monetary easing, along with bullish prospects for commodities, a turnaround in the backlogs indicator, still historically elevated inflation expectations, and still tight labour market makes for credible inflation resurgence risk in 2025; especially should global growth reacceleration become a reality. Add to that the consensus that many of the incoming Trump admin policies are likely to be inflationary, and it only builds on that background context.
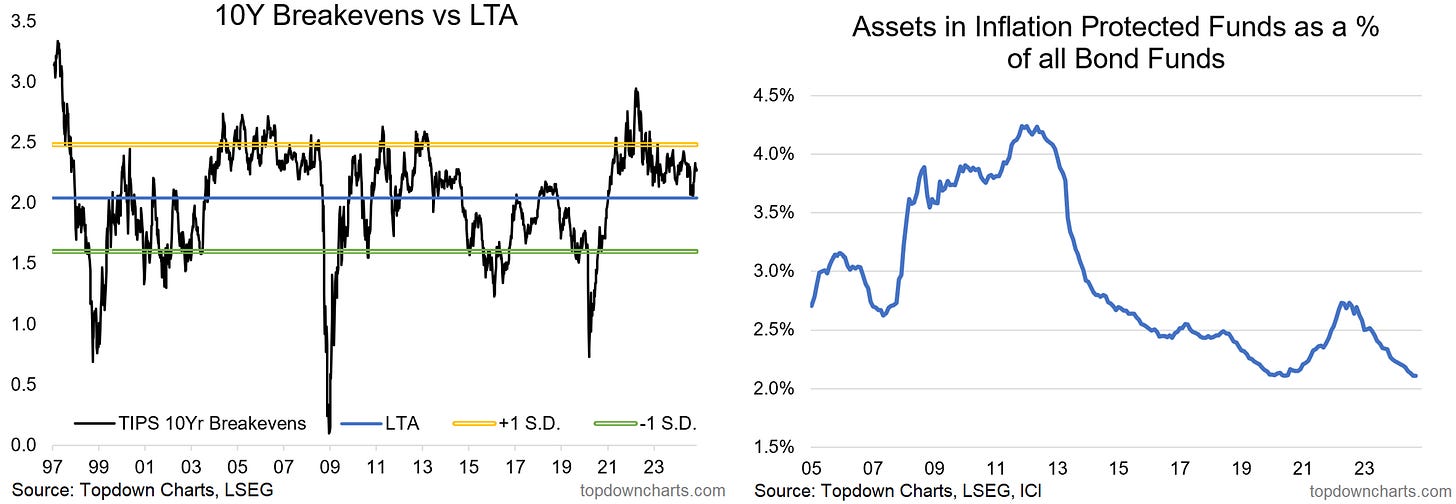
TIPS breakevens are not expensive, but definitely not cheap; could see some upside in the event of inflation resurgence. Interestingly, bond fund investors have lower allocations than usual to inflation protected funds.
Bottom line: Inflation resurgence risk is credible given monetary easing, commodity upside, turn in backlogs, elevated inflation expectations, tight labor, and prospective Trump policies.
4. Bond Yields: higher for longer risk…
The long-term rate of inflation model, long-term nominal GDP growth, and pace of global listed company capex all point to the prospect of a new higher range for government bond yields across developed markets.
One counterpoint would be the peak and pivot in policy rates (and insistence by ZEW survey respondents that long-term rates are heading lower); however while policy rate peaks have been bullish catalysts for bonds in the past, a short sharp rate cutting cycle could see the opposite effect.
At the same time, my indicators show bonds are unloved (consensus bearish sentiment) and undervalued (cheap); and so it wouldn’t take much of some sort of technical or macro catalyst/excuse to trigger a potential short squeeze/shakeout. And that could still be even a decent move but again within a higher range.
Bottom line: Higher for longer risk is set to linger for longer as long-term nominal growth and inflation models point to a new higher range, despite cheap valuations, consensus bearishness.
5. Stock-take 2016 vs 2024: “what usually happens…”
There seems to be a proliferation of commentary focusing on what markets did the last time Trump was elected, but there are a few problems with that (small sample size n=1, different team and policy agenda, and different set of background context).
Taking stock of stocks back then vs now reveals a number of key differences.
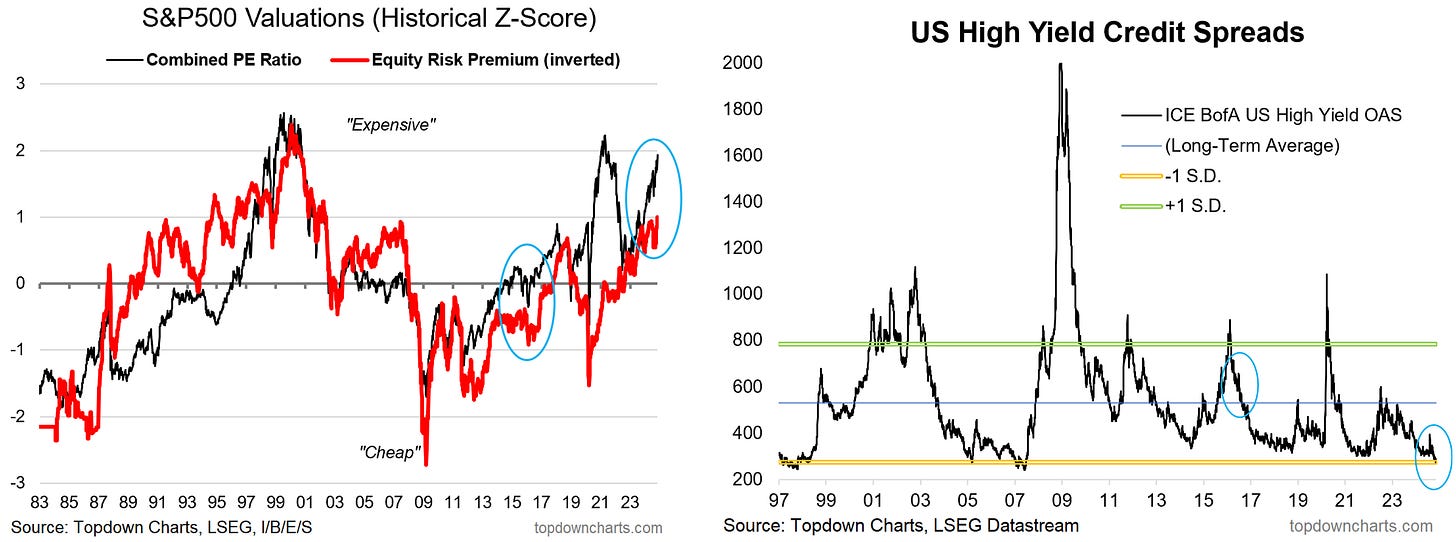
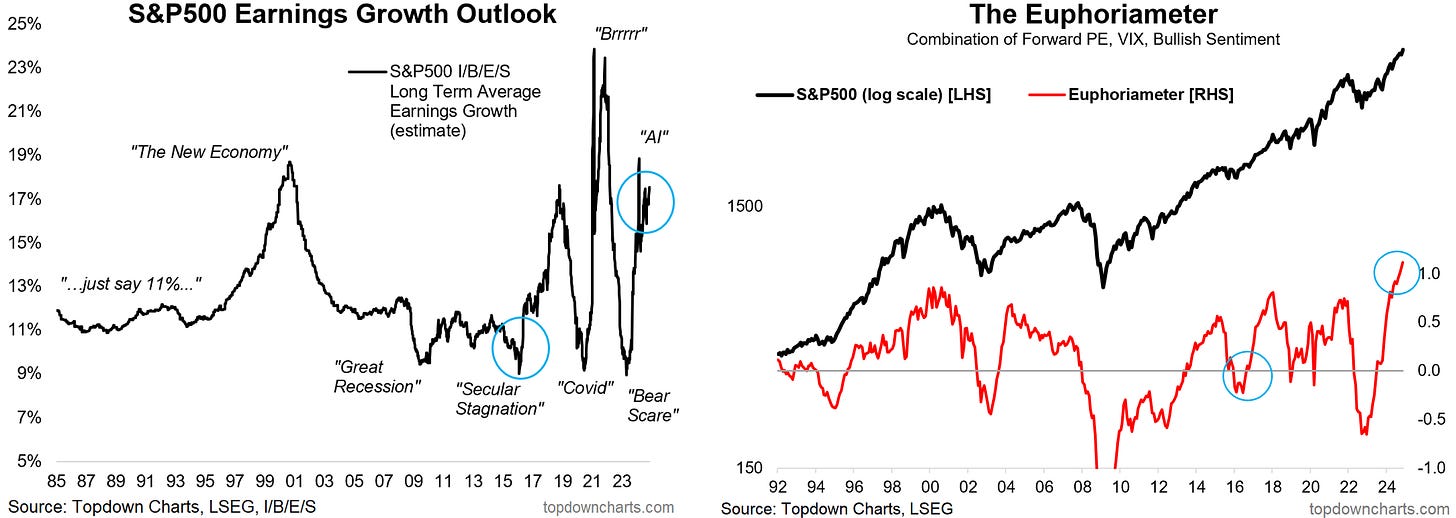
US equities are expensive now (ERP + PE) vs cheap/reasonable back then.
Credit spreads are at 17-year lows now vs around average, elevated back then.
Long-term earnings expectations are very high now vs rising off record lows back then.
Euphoriameter sentiment indicator is at record highs vs pessimistic/bearish back then.
Rate cuts are only just beginning to ratchet up now vs ECB/BOJ QE + China stimulus back in 2016.
S&P 500 effective corporate tax rates have already come down a lot, may not move much lower.
[BUT] Small caps are cheaper than back then, value vs growth much cheaper, and global stocks slightly cheaper than back then; so there is the relative value and rotation opportunity aspect.
The incoming administration therefore is going to face some pretty high hurdles should they want US stocks head higher from here (given expensive valuations, lofty sentiment); it will require things going really well (or crashing early with shock and awe treatment, to recover stronger later).
Bottom line: It’s hard to extrapolate what happened when Trump got elected in 2016 to 2024 as the background context (valuations, sentiment, policy) is entirely different (high hurdle for stocks to head higher).
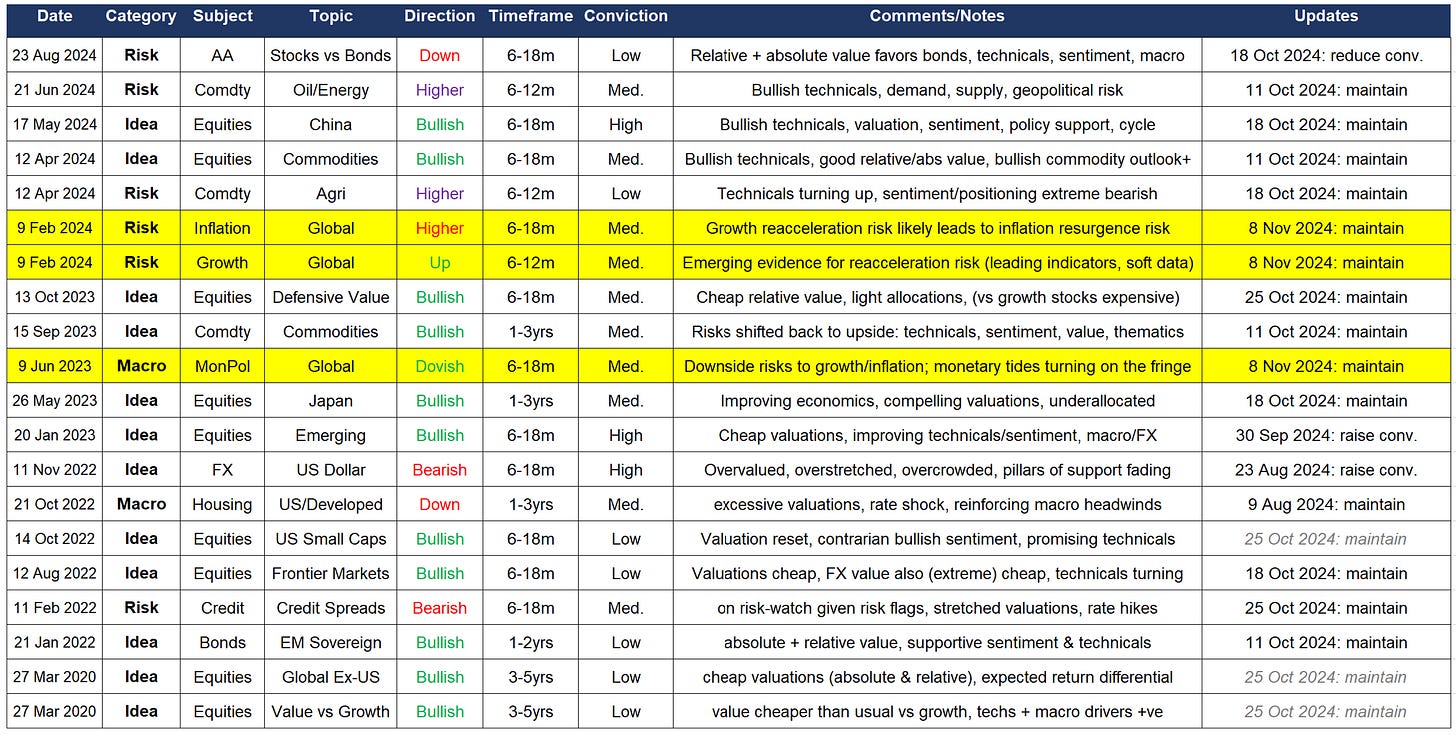
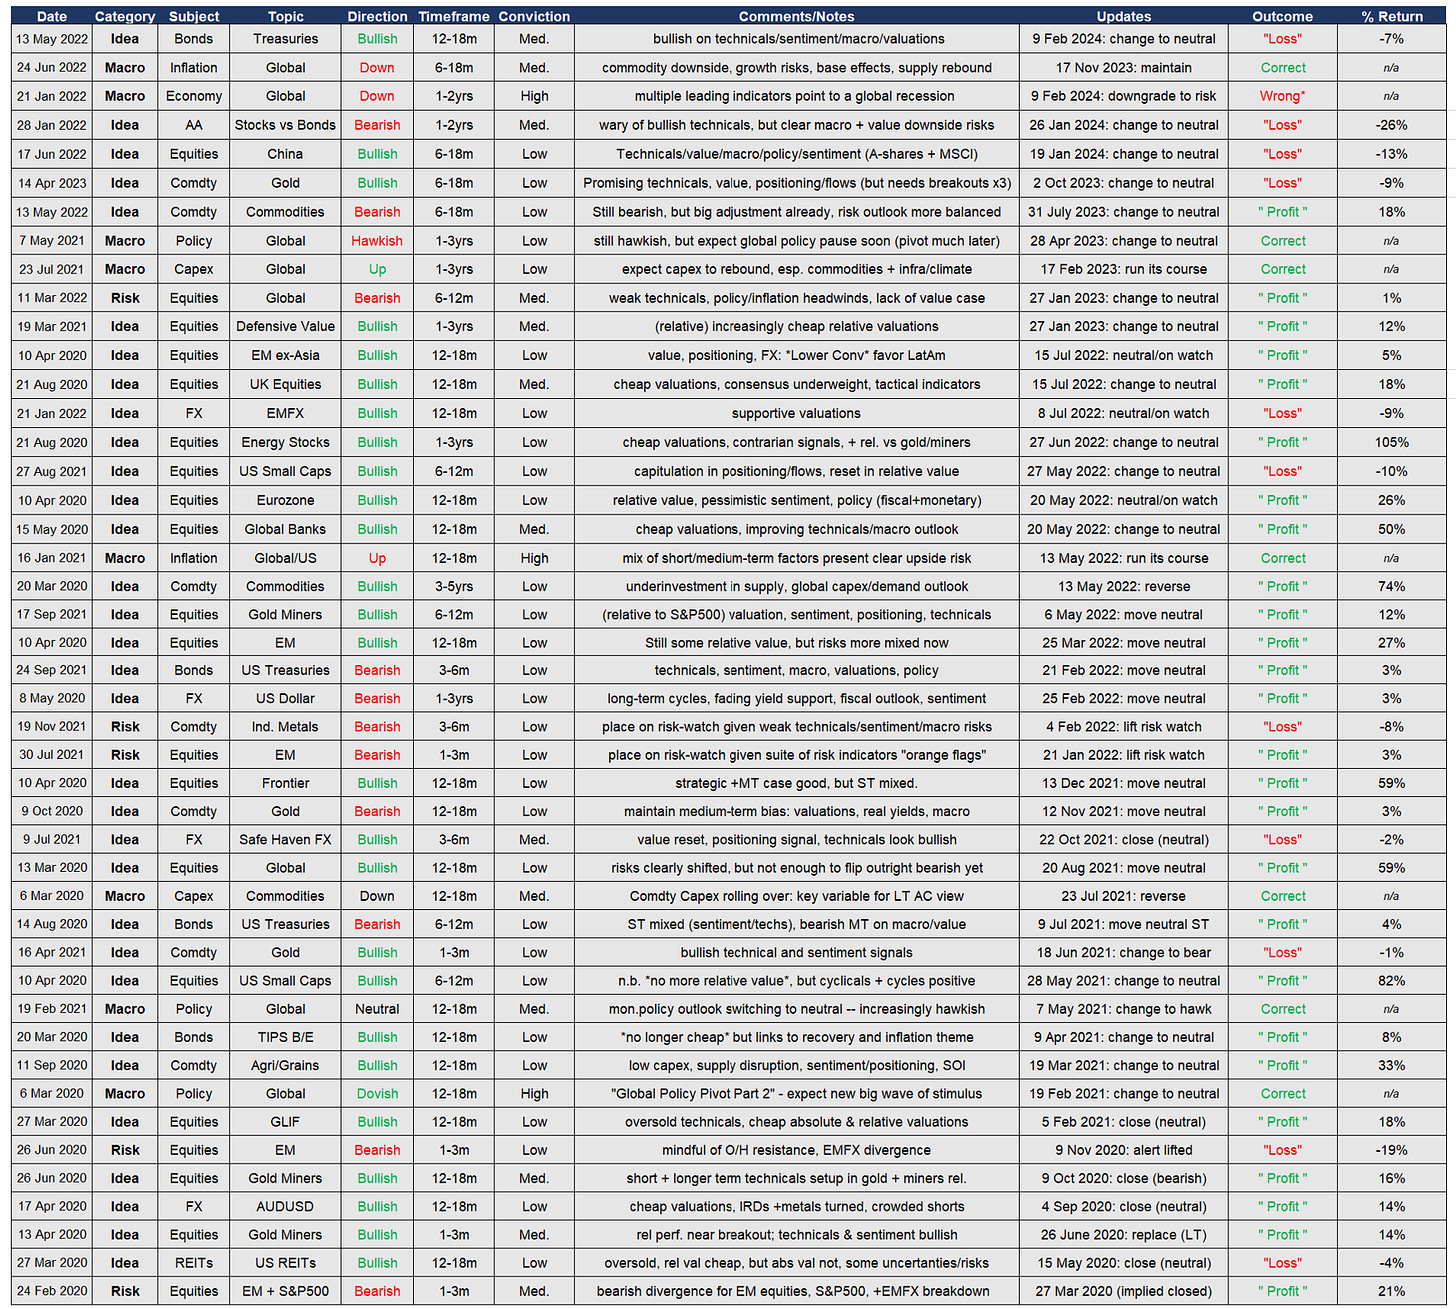
Ideas Inventory - Updated to 11 Nov 2024
(Current live Ideas/Themes where an explicit view has been issued)
(Closed/Past themes and ideas)
If you haven’t already, be sure to subscribe to this paid service so that you can receive these reports ongoing (along with full access to the archives and Q&A).
Thanks for your interest. Feedback and thoughts welcome in the comments below.
Sincerely,
Callum Thomas
Head of Research and Founder at Topdown Charts
Follow me on Twitter
Connect on LinkedIn
n.b. this is the Topdown Charts Entry-Level service, for the full institutional service see: www.topdowncharts.pro (reply to this email if you’d like a trial)





Insomnia strikes…. But blessed by Weekly Insights 🙂🙏🙂