
Weekly Insights - Edition 186
This week: market update, global equity technical risk flags, the Gold 60/40, US housing market, US small caps, UK equities, European equities...

Welcome to the Weekly Insights report! The weekly insights report presents some of the key findings from our institutional research service, providing an entrée experience (in terms of price and size).
Global Markets Monitor - notable developments
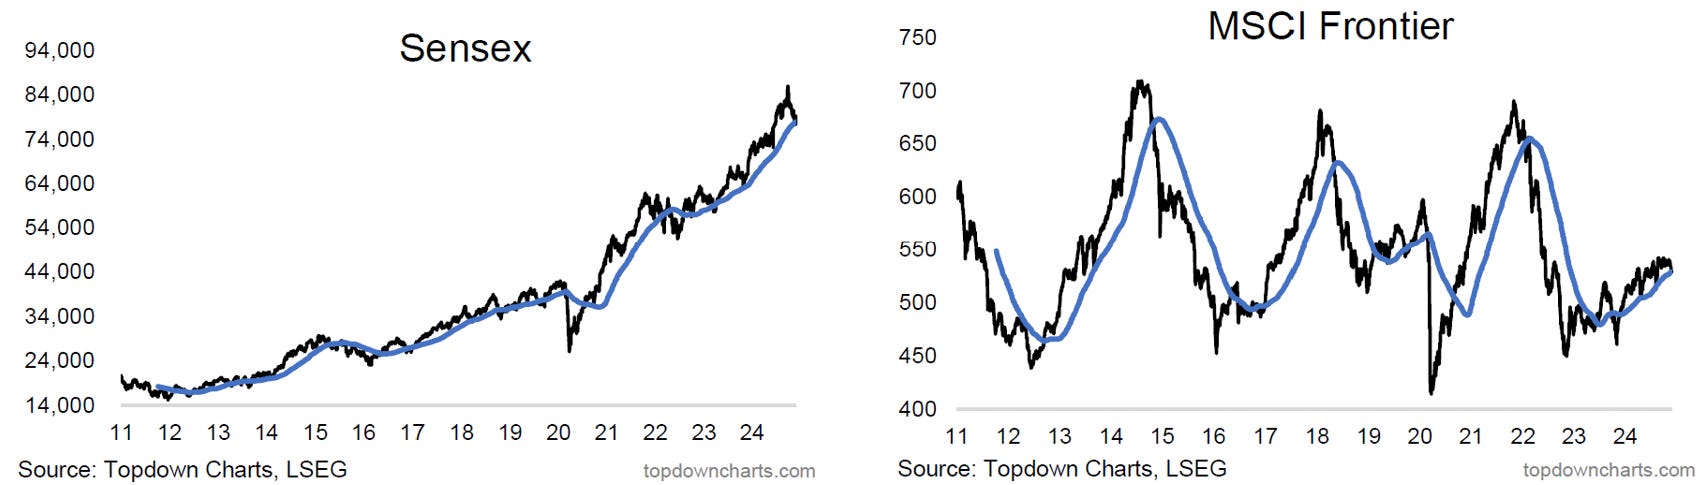
Stocks were mixed last week, US rebounded, Canadian stocks strengthened further, Europe and Japan slightly weaker, emerging markets mixed to weaker (with Indian stocks notably softer in recent weeks), frontier also pulling back slightly from the highs.
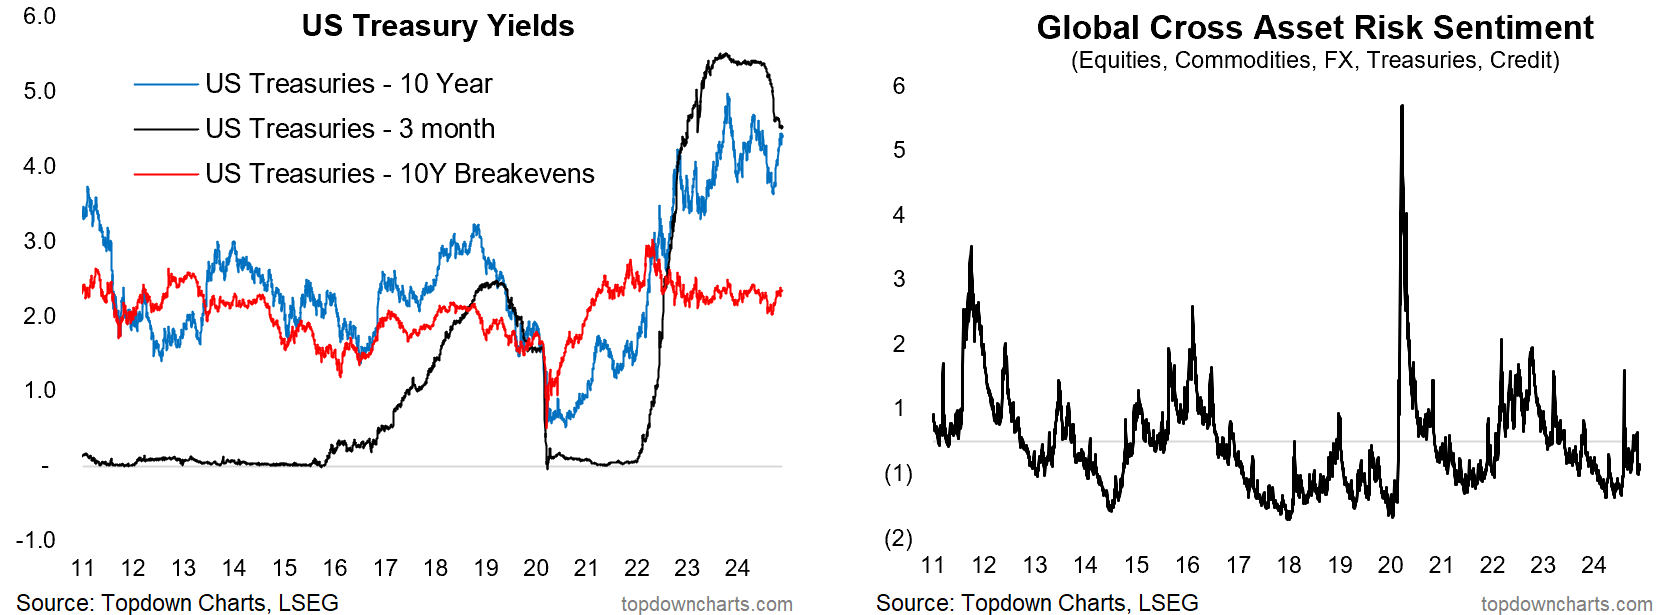
In fixed income, treasury yields are consolidating round the highs, while credit spreads made a slight pause in their string of declines. Global sovereign yields were mixed-to-lower.
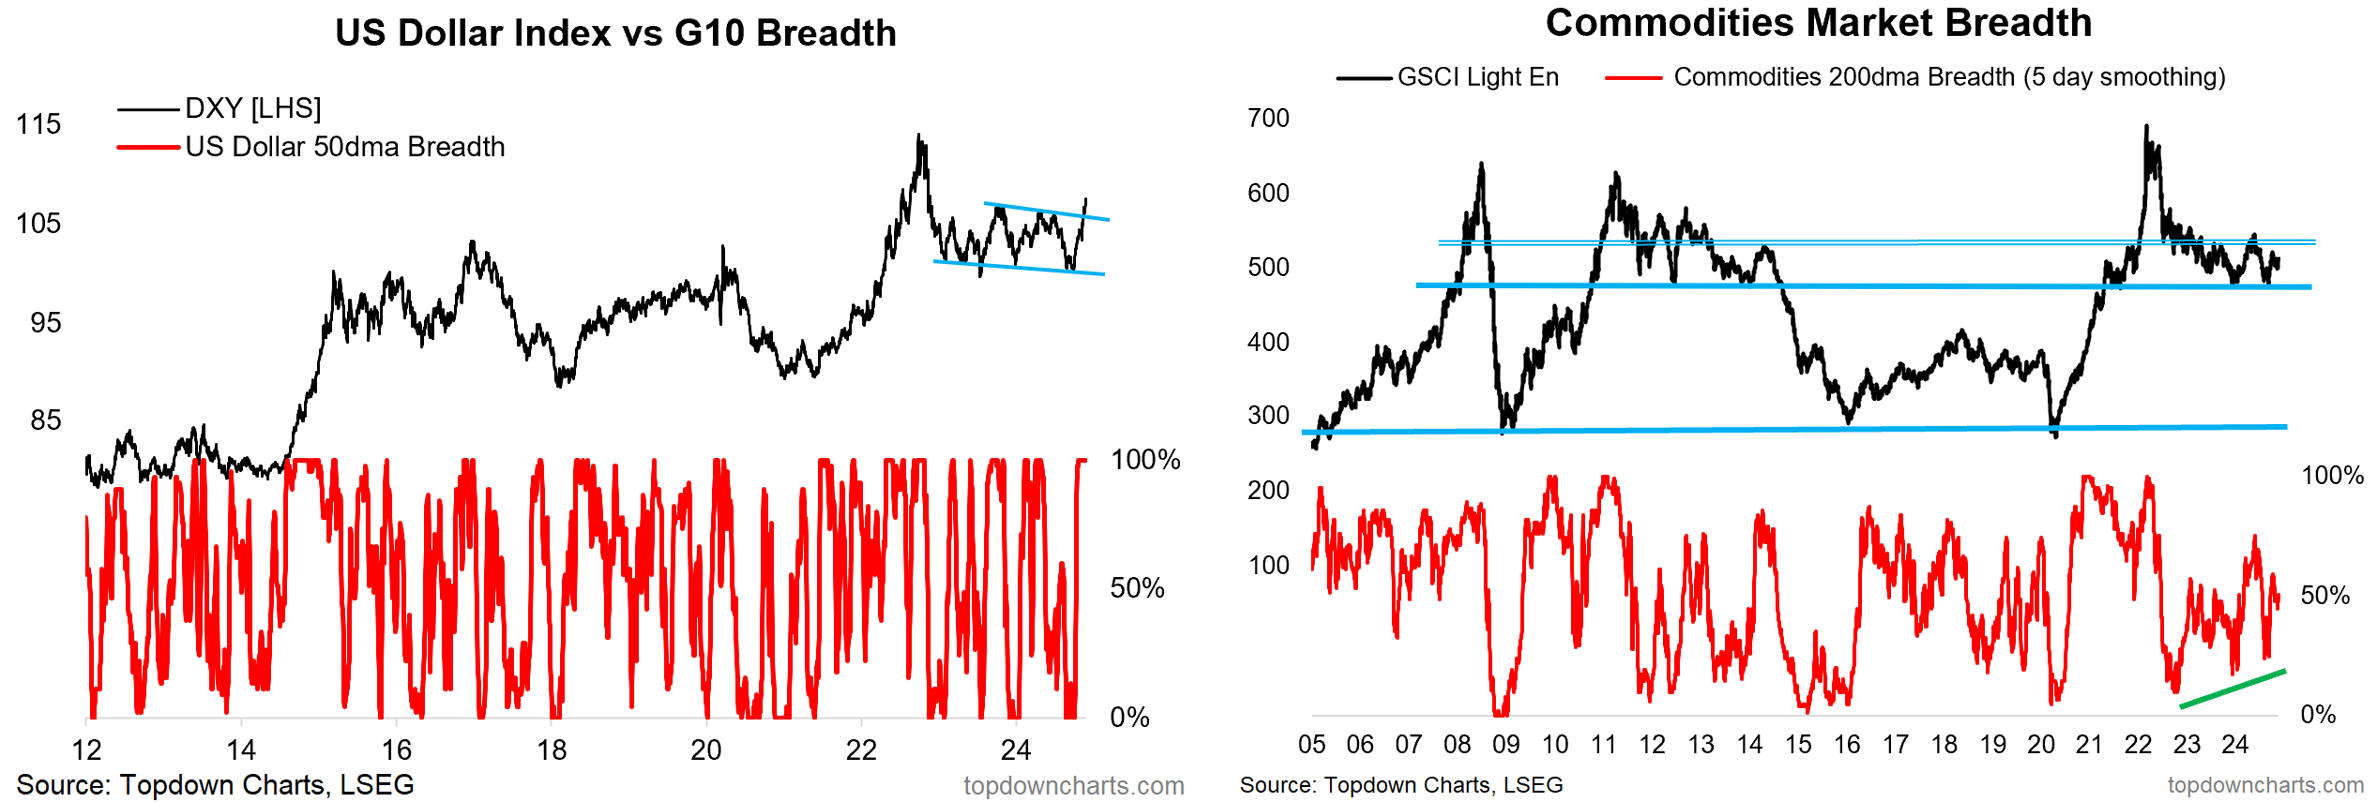
In FX, the US dollar index made an initial breakout above its short-term overhead resistance line, Asian/EMFX slightly weaker, EURUSD attempting a major break down. Commodities meanwhile continue to hold onto support with mixed trading; agri slightly stronger, base metals consolidating, crude oil holding support, gold gaining again.
Market themes: Global Equities...
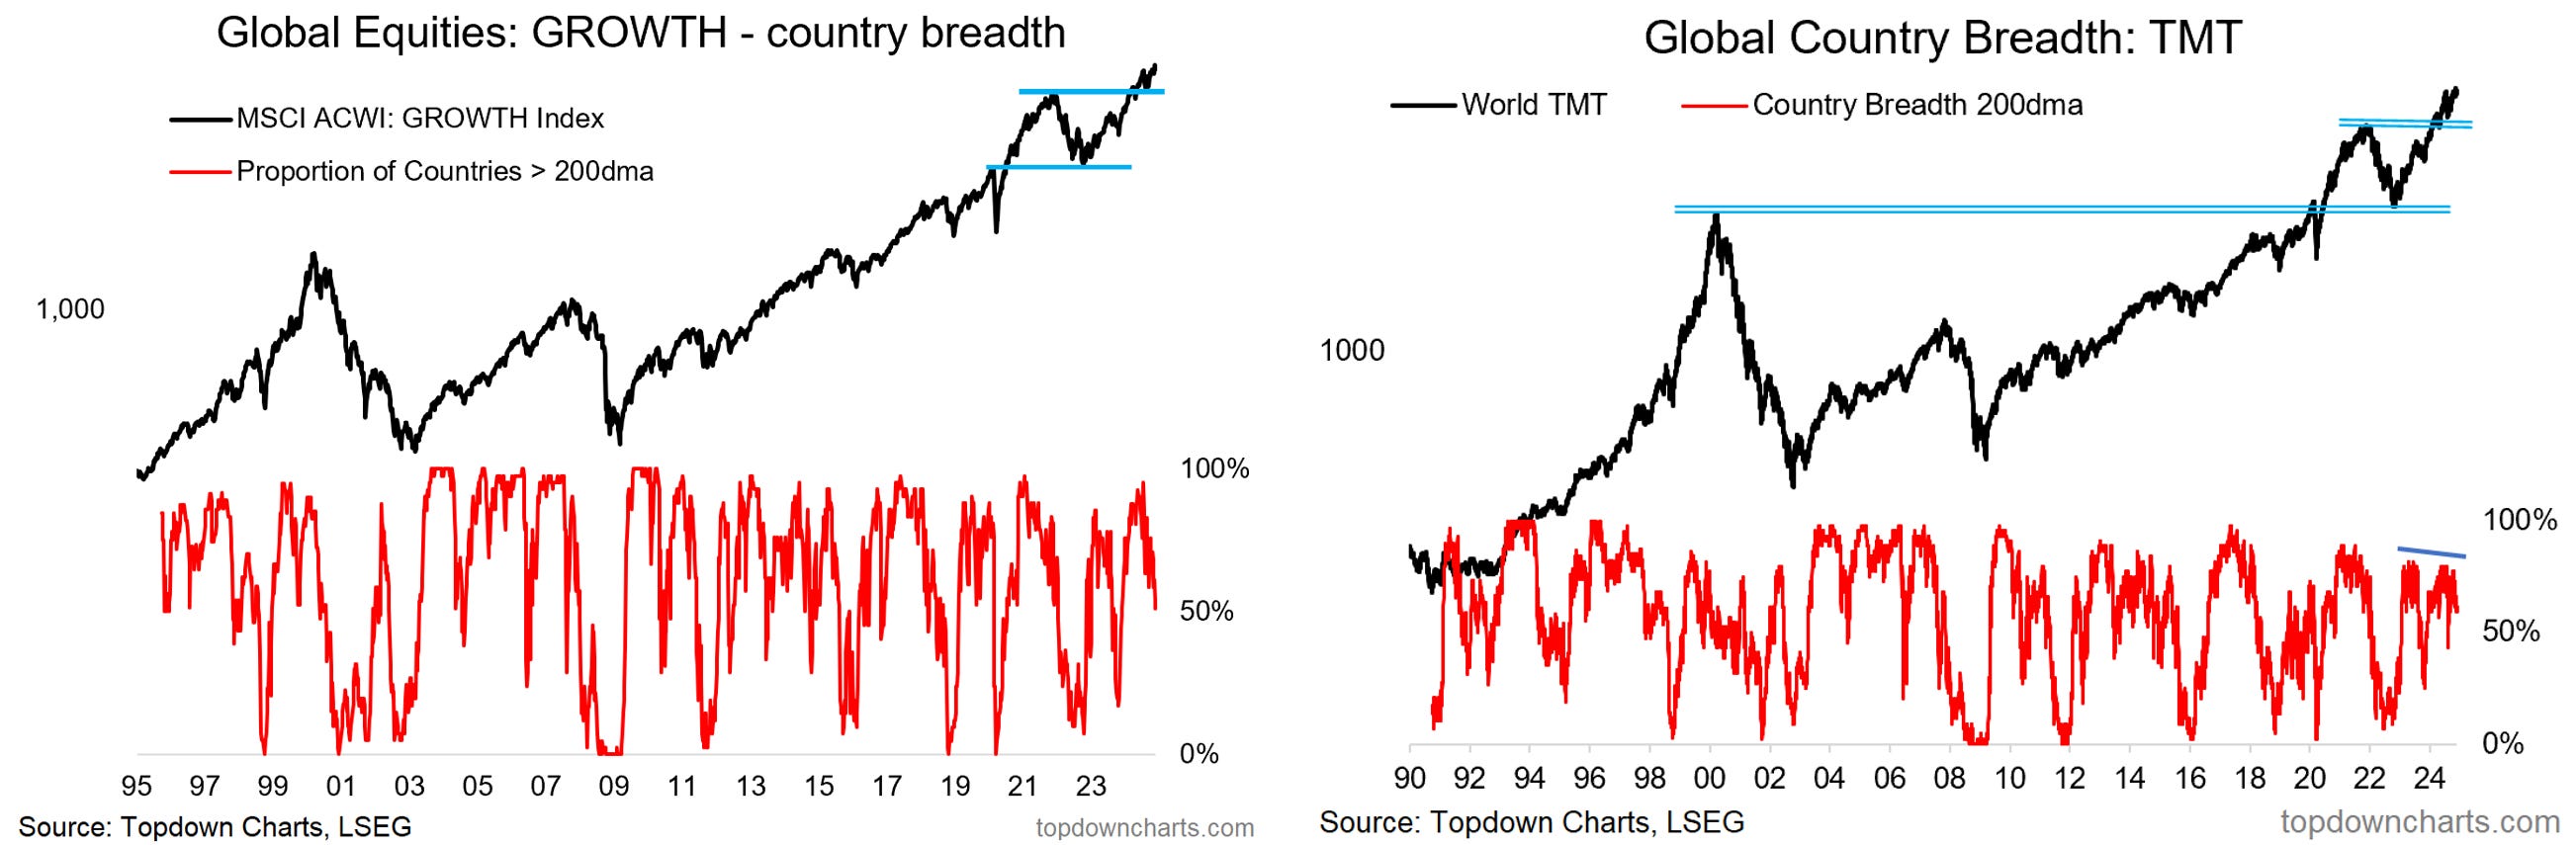
-Global growth and TMT stocks are stumbling
-Cyclicals vs defensives and momentum + growth factors are presenting risk flags
-Global stock/bond ratios (ex-US) have been on a weakening path since May
-Global ex-US equities have pulled back to test support after failing to make new highs
--overall the (bull) trend still looks strong, but there are a number of short-term risk flags waving for global equities
---this comes at a time where sentiment is perhaps a little overcooked, and expectations for year-end rally is running high
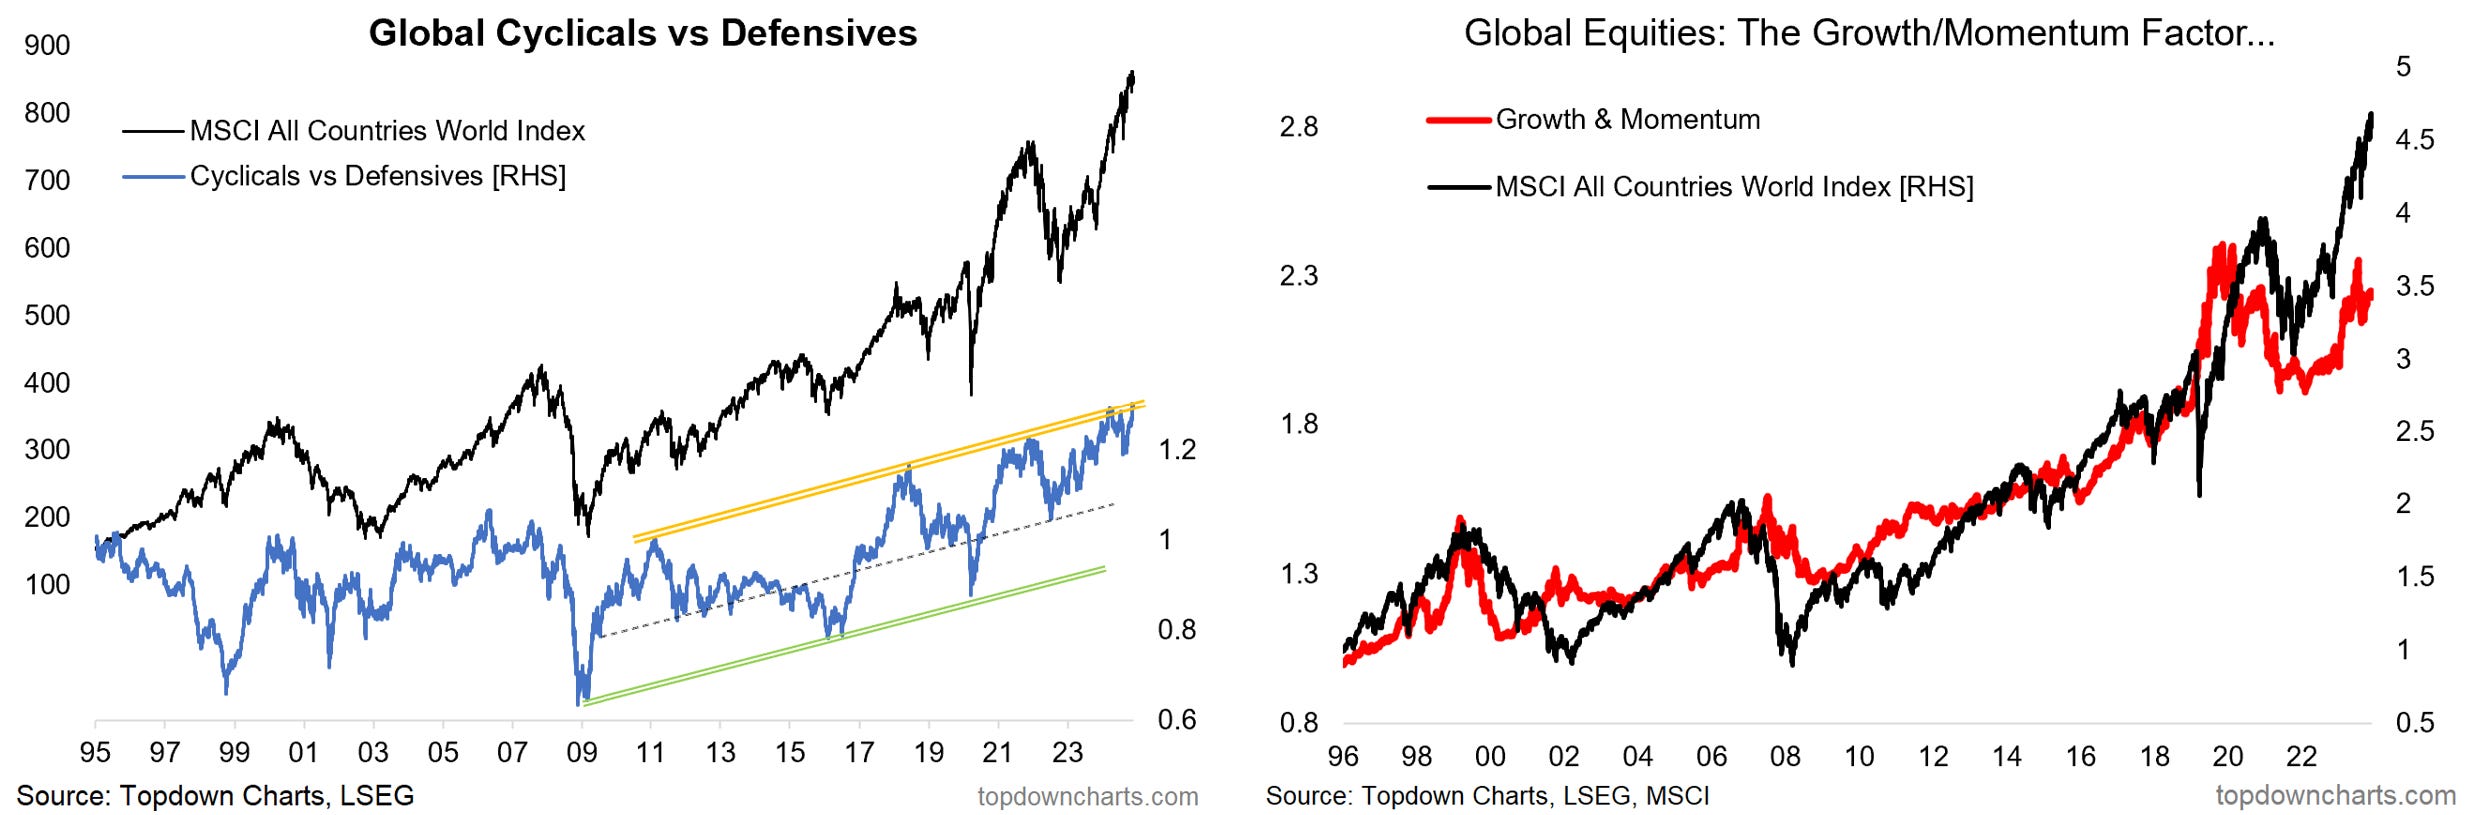
Globally growth/tech stocks are hitting the skids, cross-country breadth is rolling over and the world growth + TMT indexes are stumbling off the highs.
While cyclicals vs defensives are going strong, they are hitting what has been a bit of a warning zone in recent years (global equities tend to run into issues when cyclicals/defensives reach the upper end of their trend channel). Elsewhere growth & momentum relative performance (and quality) are not confirming the new highs in the ACWI; basically a bearish divergence.
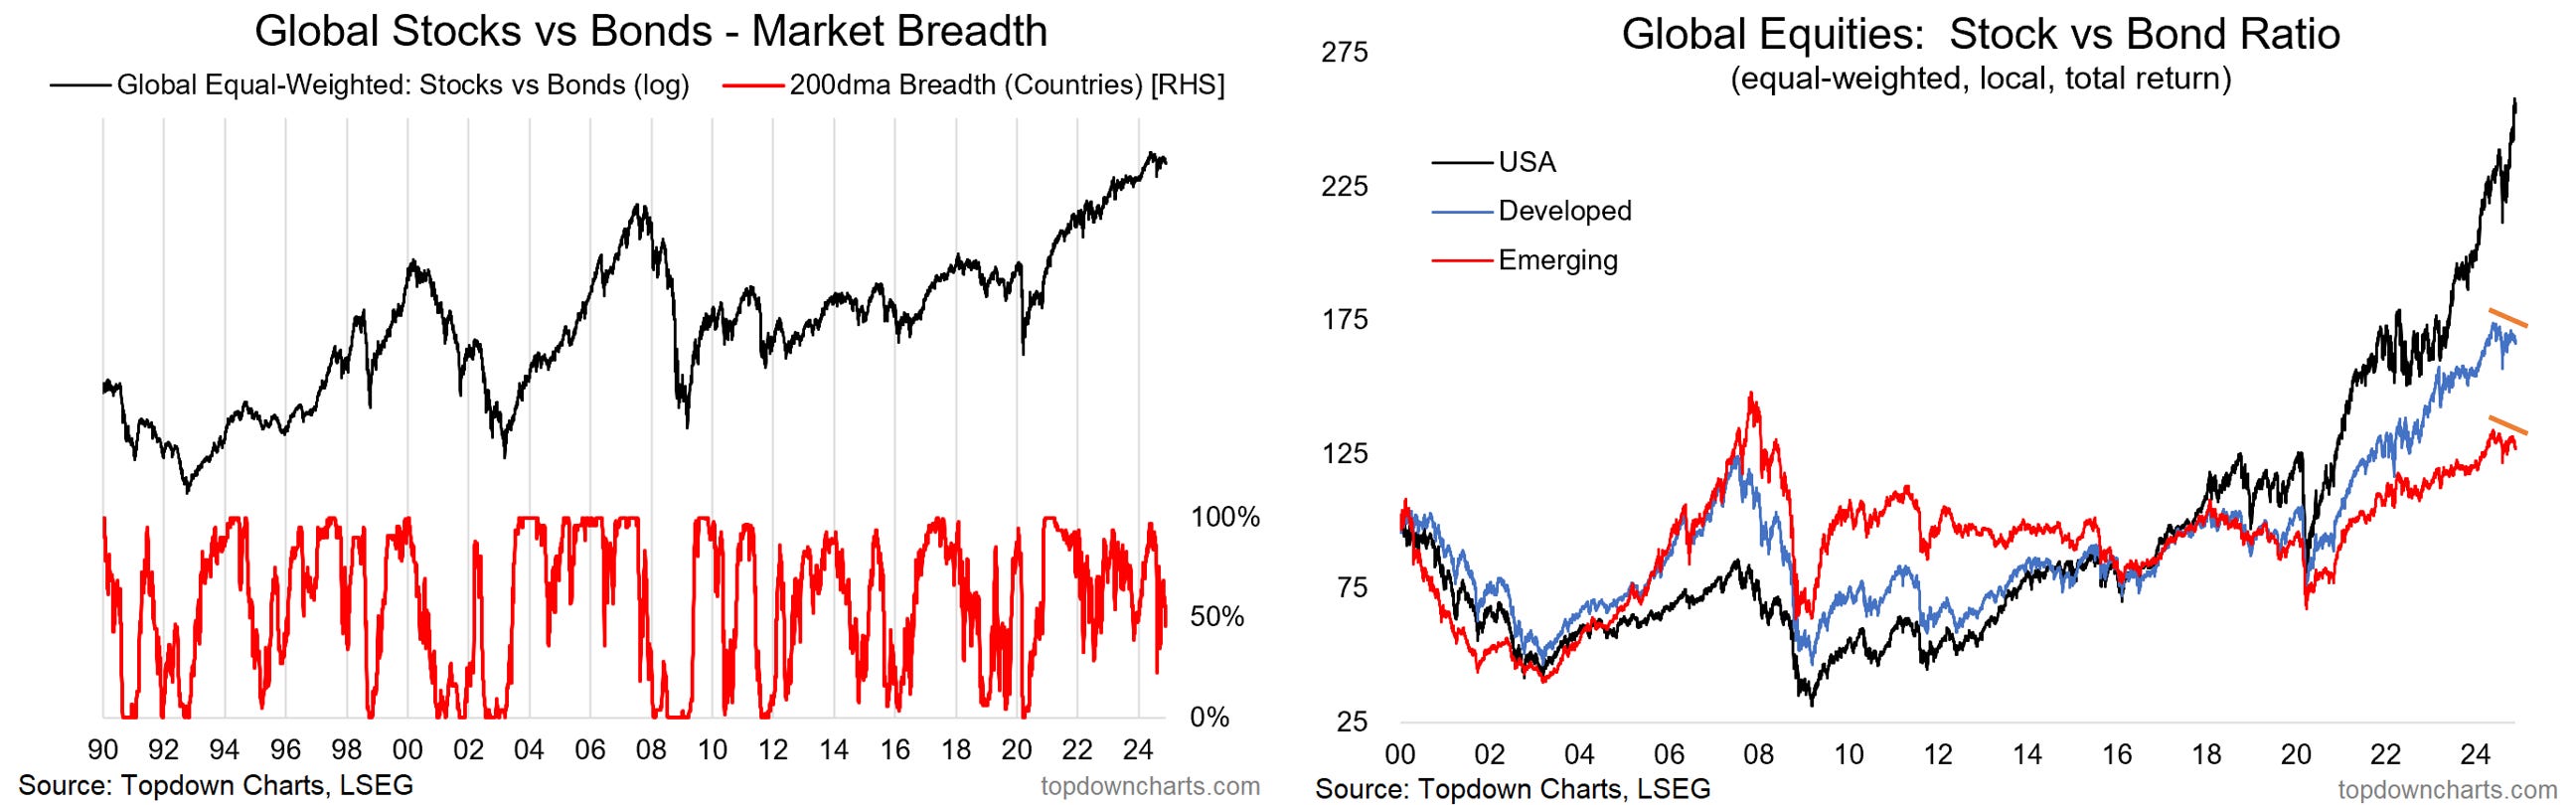
Another interesting snippet is the global equal-weighted stock/bond ratio peaked back in May, and cross country breadth of stock/bond ratios has been notably weaker. One interesting observation is how both developed and emerging markets are seeing their stock/bond ratios soften, while US is an outlier (always pays to watch for these types of divergences).
Lastly global ex-US equities have rolled over off the highs after failing to make it out to new all-time highs -- they now contend with a major support level and softening breadth; take along with the rest of the charts above it's enough to sharpen the focus on downside risk for equities heading into what most expect to be a typically strong part of the year (sentiment is a bit too complacent/euphoric, on my read).
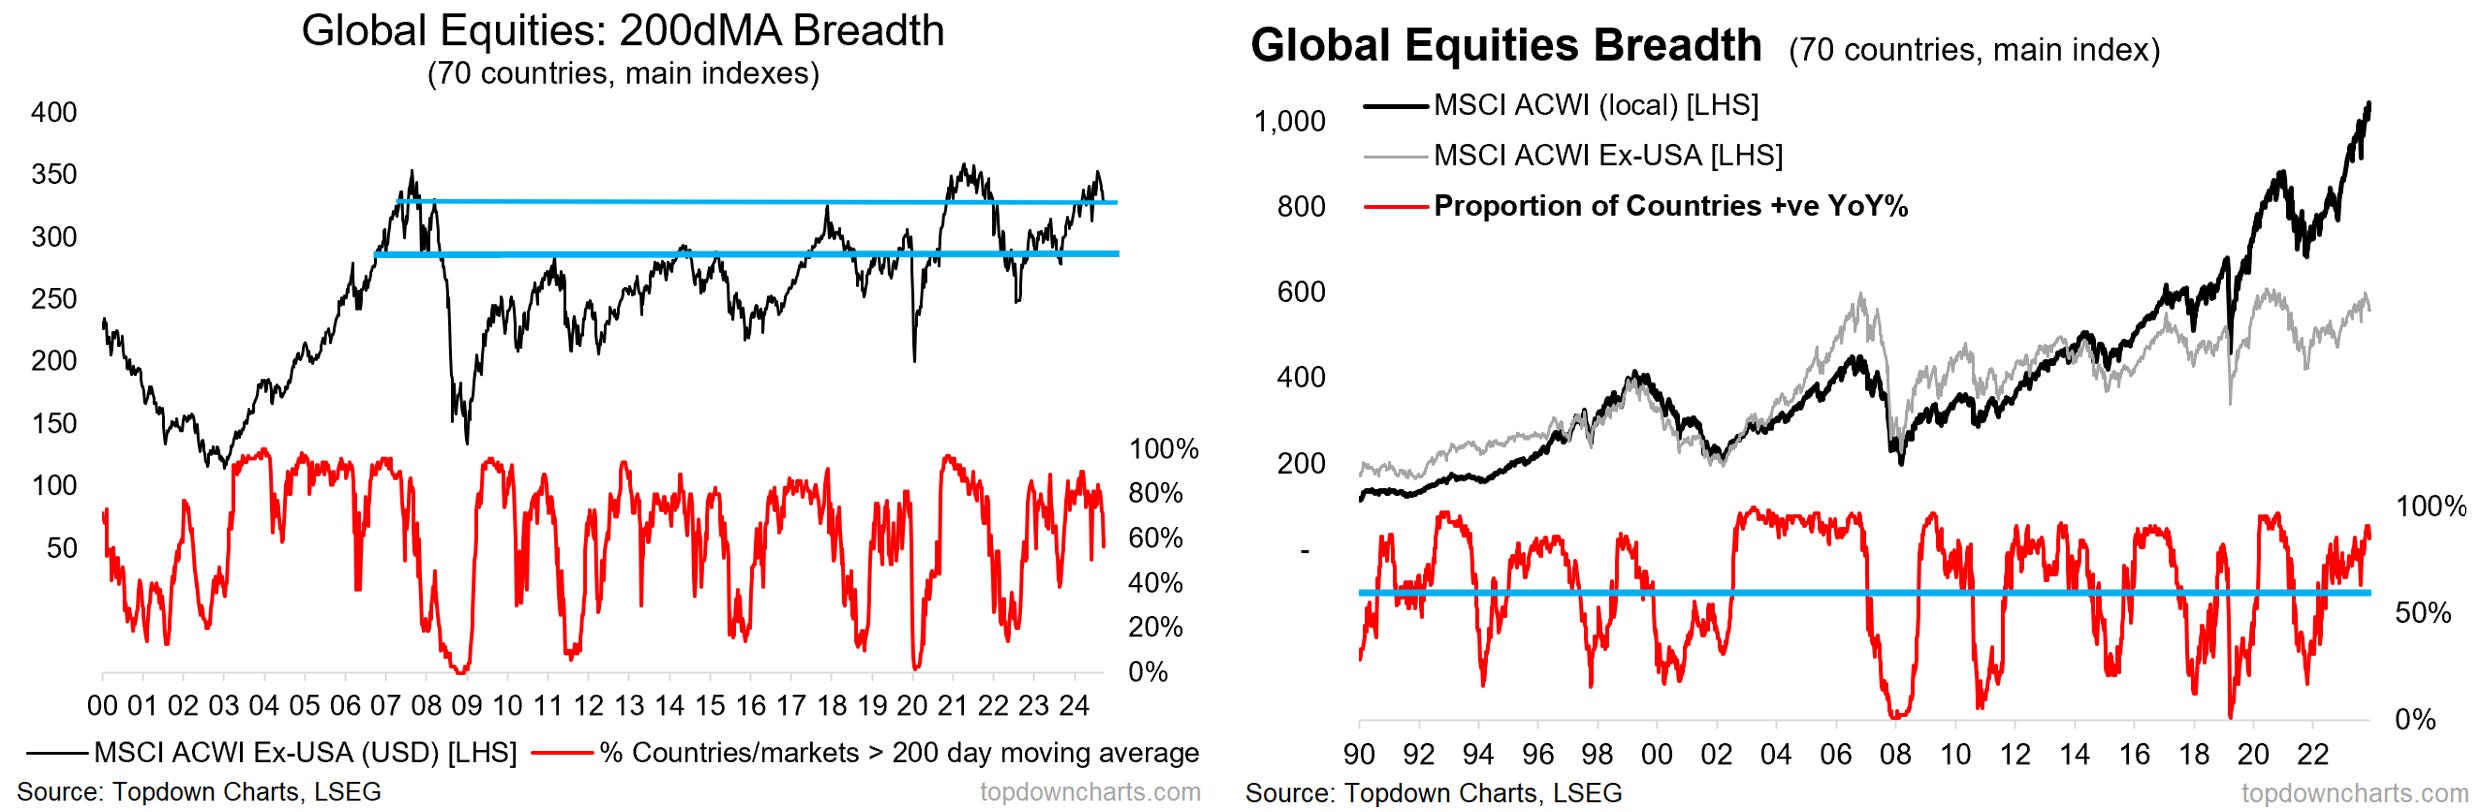
That said, on all counts the trend is still up across global equities, and the YoY breadth is still clearly in bull market mode; in other words I am looking at this all as basically a short-term correction/sell-off risk flag, rather than something larger (but these things can change quickly, so definitely not a time to get complacent).
On the Radar
Macro & Markets: This week there’s US house prices and consumer confidence, the RBNZ with likely another rate cut, FOMC minutes, later in the week US Thanksgiving holiday, and China PMIs for Nov.
In markets, US 10yr yields are consolidating round the highs, DXY making an initial breakout, gold rebounding post-correction, WTI crude rebounding off support, and stocks ticking higher...
Research Agenda: This week I’ll be taking a look at emerging markets, frontier markets, EM debt, global equities, and stocks vs bonds.
Weekly Macro Themes Report - key points
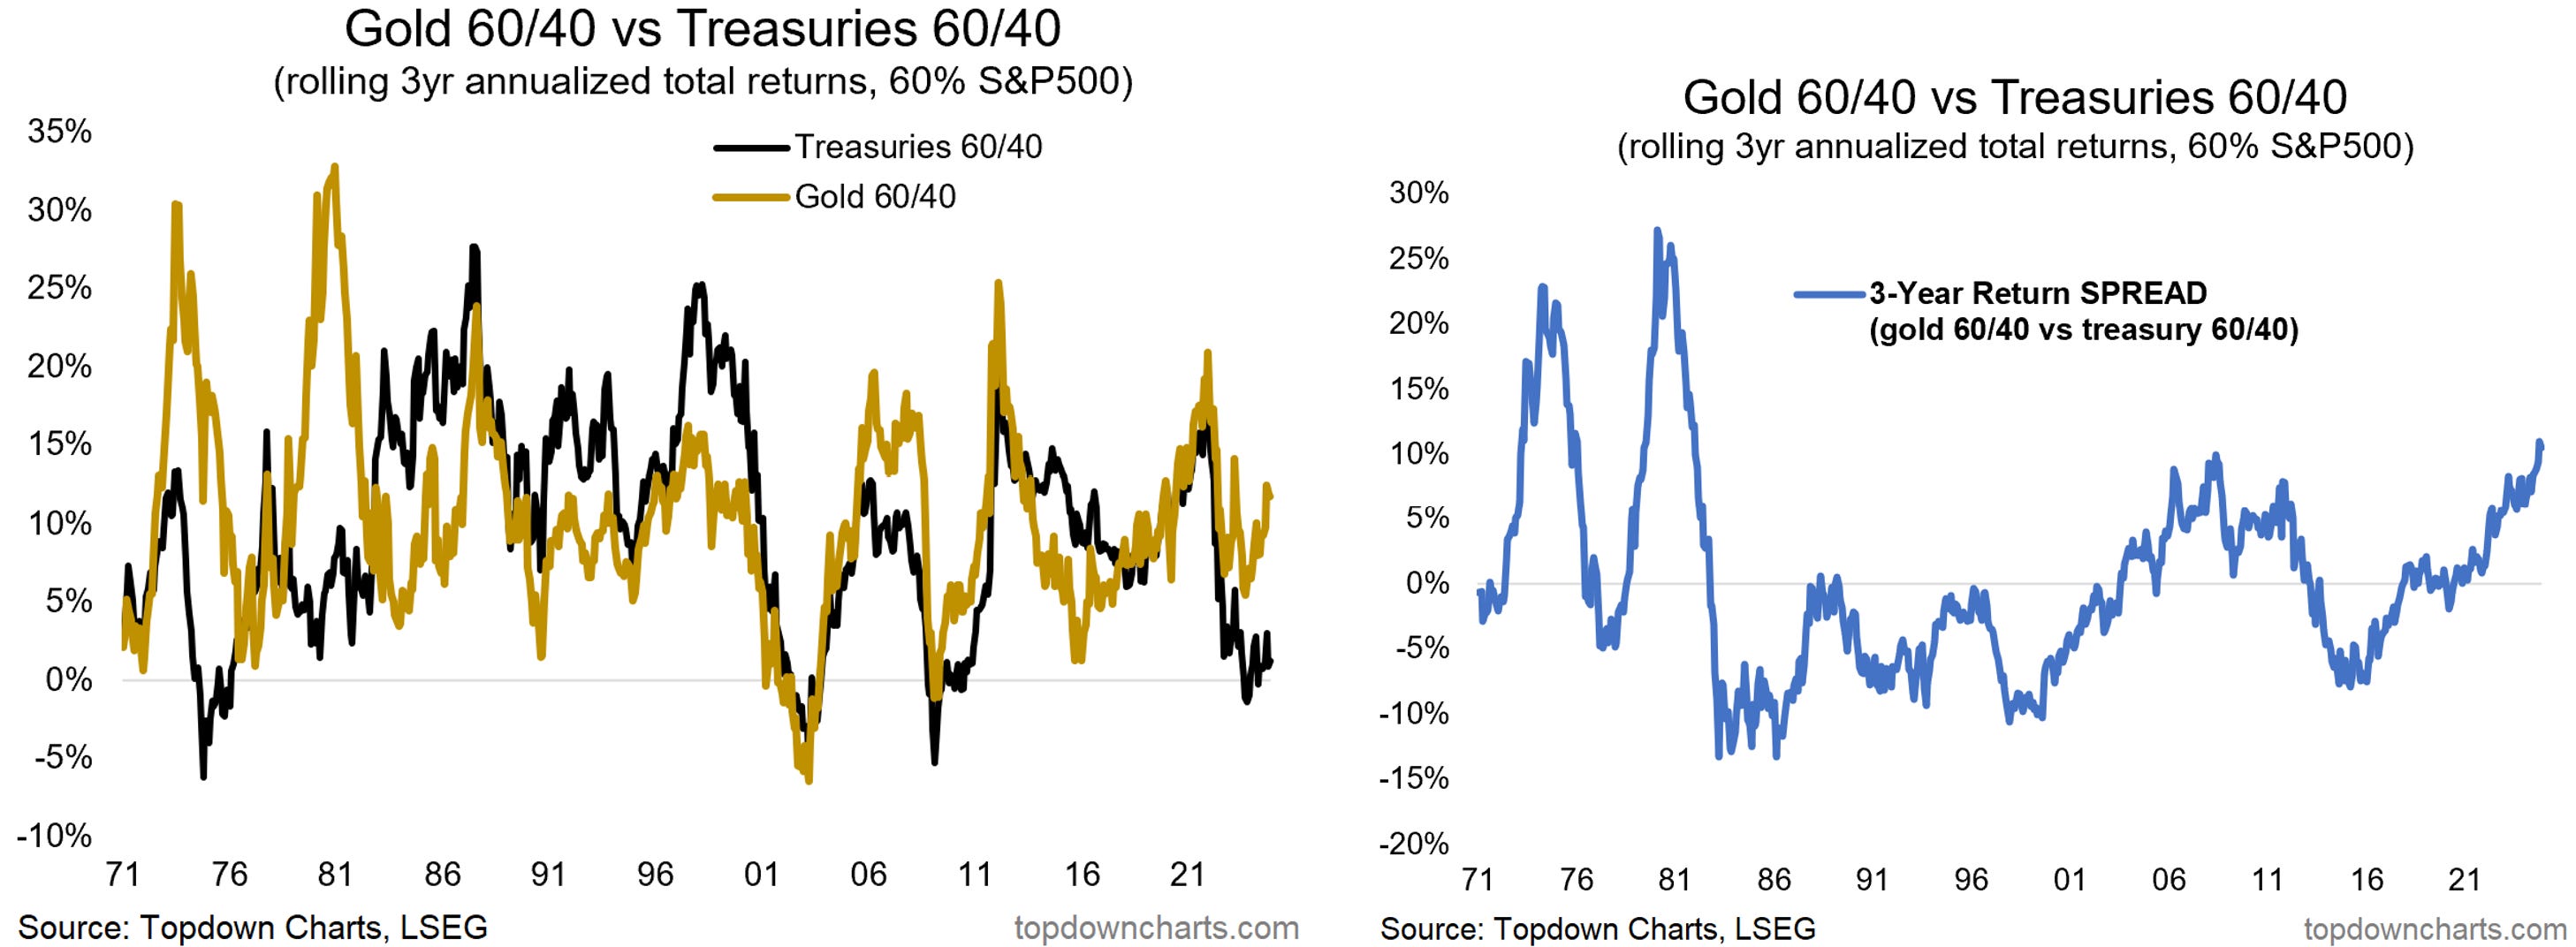
1. Gold 60/40: digging into diversification…
Looked at the traditional 60/40 portfolio (60% in stocks, 40% in bonds), vs the idea of the gold 60/40 (putting the 40% in gold instead). This strategy would have outperformed the traditional approach in recent years (since March 2020), but over history the two approaches have at times significantly under/out performed each other. This in my view presents two key takeaways:
Diversify Diversifiers (some gold, some bonds) – both are viable substitutes, have differing and varying correlations to stocks, different volatility/risk over time, and different cycles of performance.
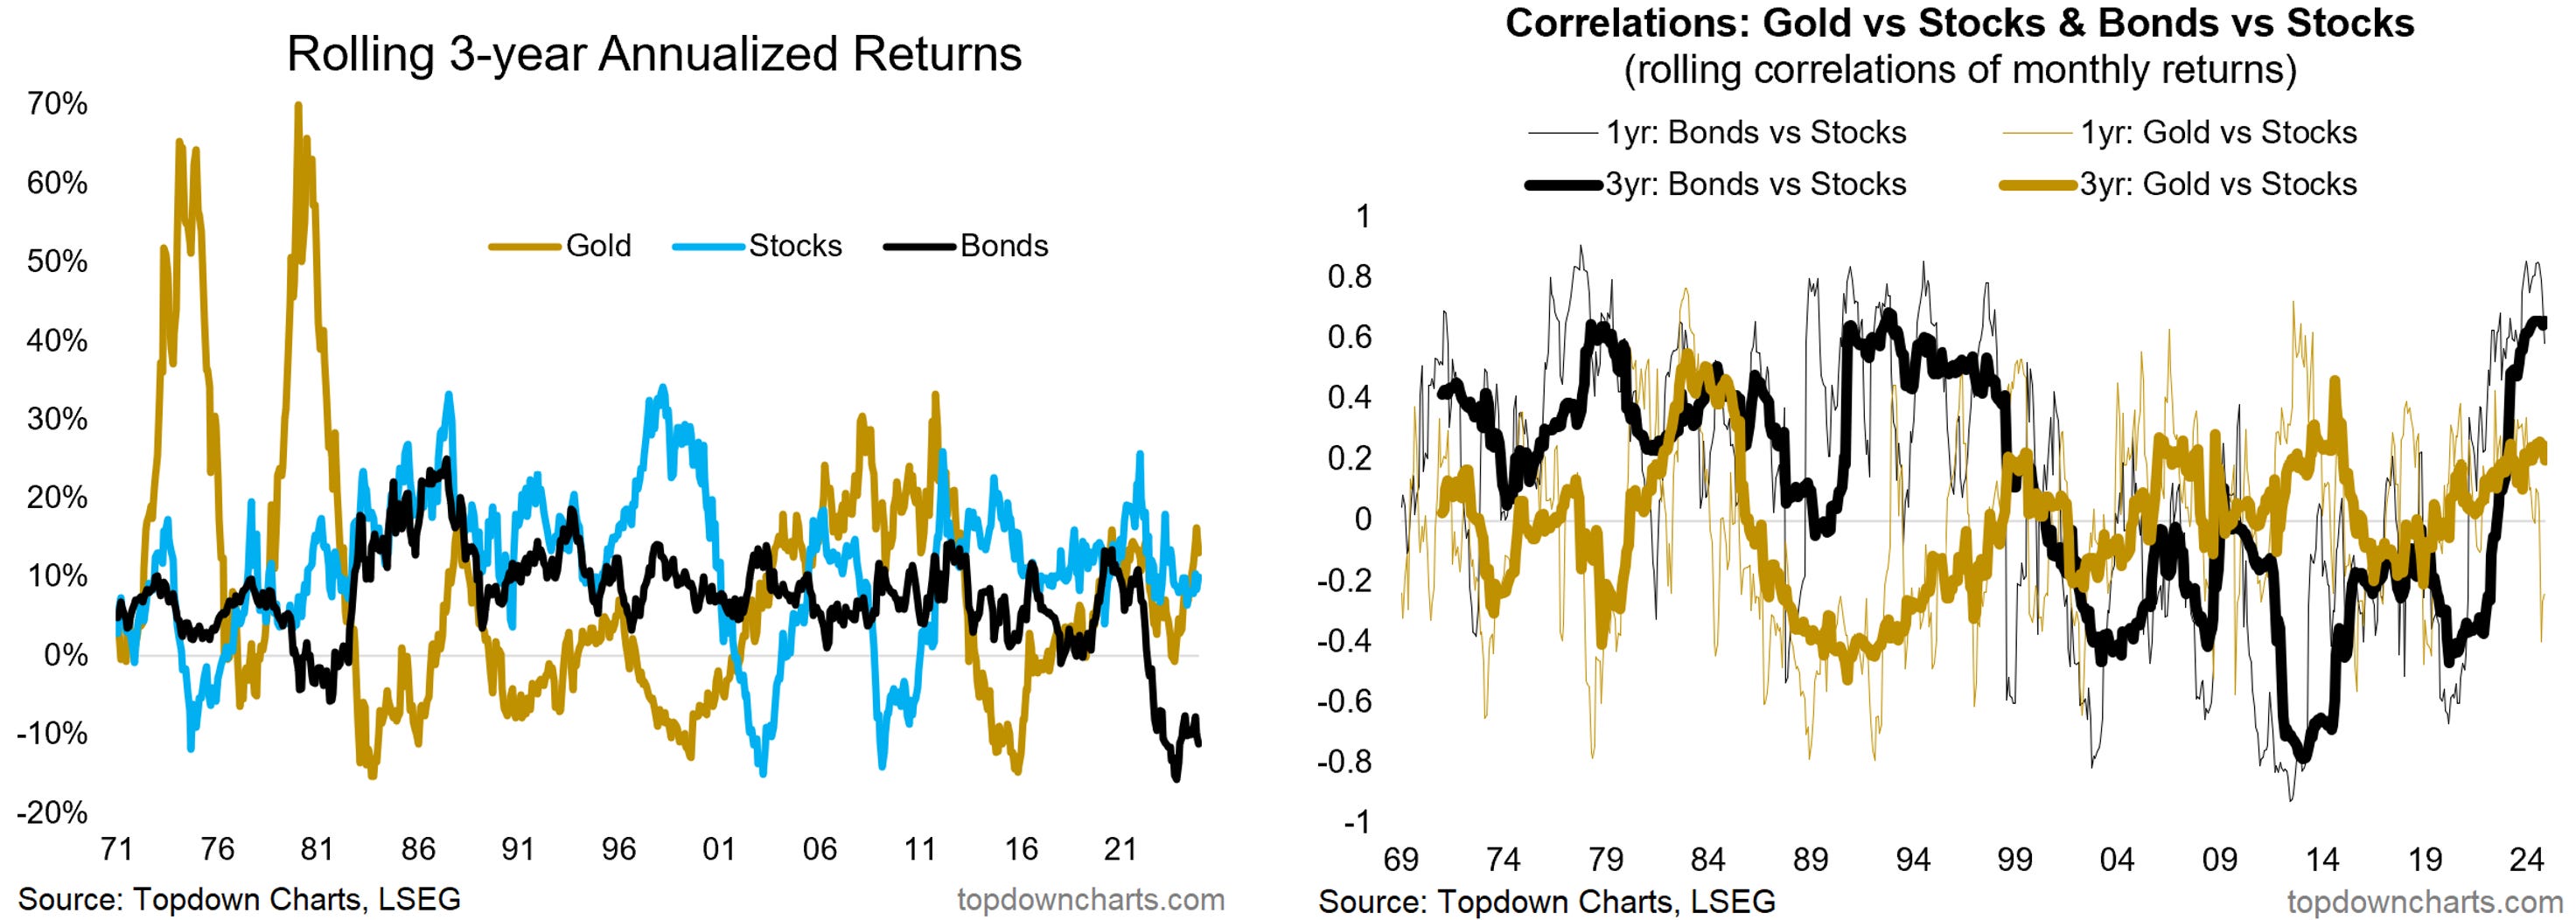
Diversify Discerningly (gold sometimes, bonds sometimes) – be valuation-aware in dynamically assessing diversifiers to make sure that they have a greater chance of being a dampener and diversifier of risk, rather than a source of risk (e.g. bonds were extreme expensive in 2021, prior to their disastrous drawdowns alongside stocks).
Given the existing run in gold (and expensive valuations now), vs cheap valuations for bonds, now is probably not the time to chase gold 60/40, rather bond 60/40 may do better, or a combination, or… just taking actually a wider universe of assets, which most best-practise allocators actually do nowadays.
Bottom line: In comparing gold vs bonds for the 40% in 60/40, the key conclusions are to diversify diversifiers and to diversify discerningly (be valuation-aware).
2. US Housing: seller stalemates, correction in time…
Despite the shock to housing affordability/purchasing power (from the surge in servicing costs for new buyers), house prices have held up relatively well in the US (thanks in part to locked-in-low-rates, high immigration, seller stalemate). Sales volumes remain very low as folk are reluctant to sell.
Leverage is still relatively high vs history, but has come down a lot since the credit bubble of the mid-2000’s – this shows that you can get boring drawn-out and benign deleveraging +correction of market extremes.
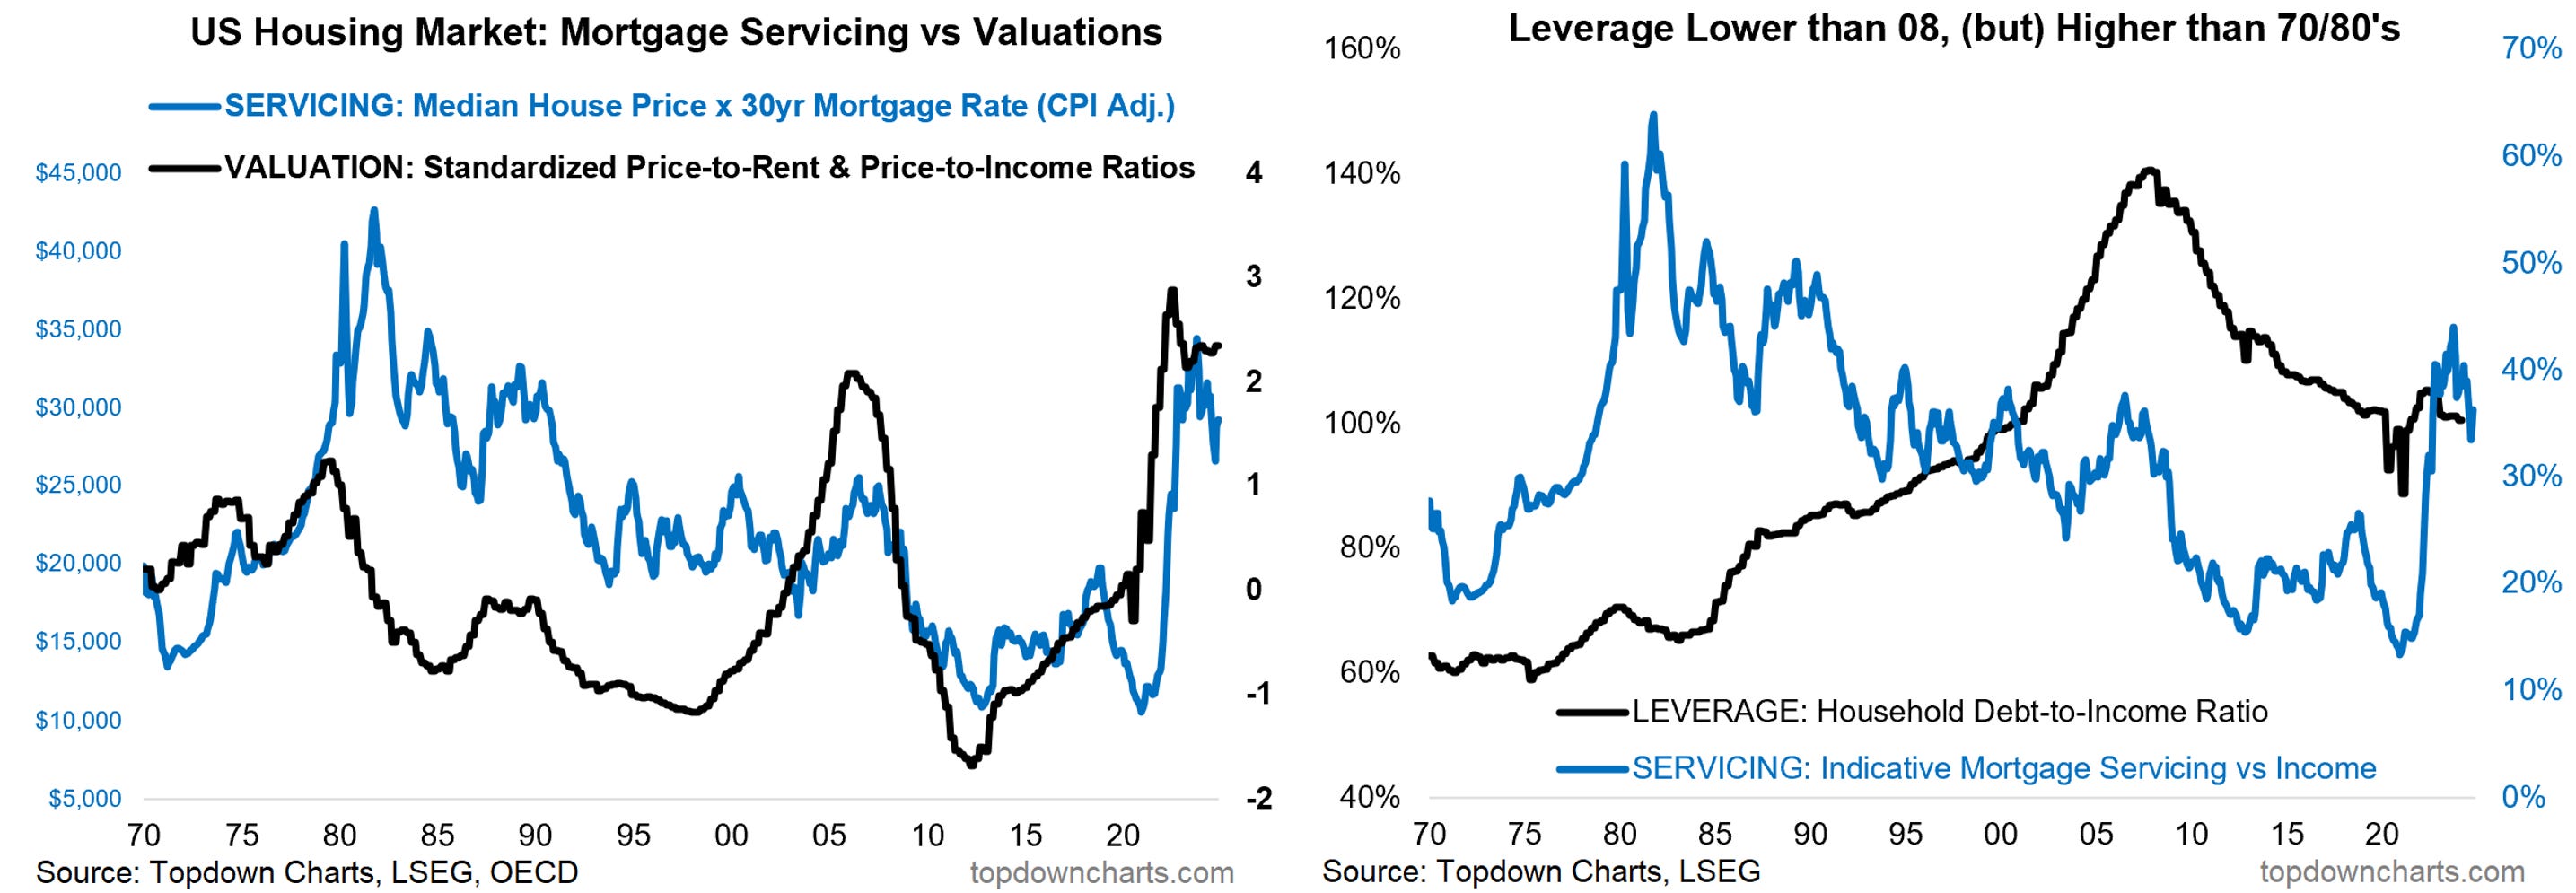
Valuations remain near record highs; this will resolve eventually (either through lower prices, higher supply, or a correction in time). At the moment I would say a correction in time is the most likely (prices stay steady given higher for longer mortgage rates, while incomes and rents rise to slowly and stealthily resolve valuation extremes and eventually improve affordability). So at worst you see destruction of wealth, while at best you see property not being the same tailwind to wealth it has been in previous decades.
Bottom line: Valuation indicators remain near record highs for US residential property, this can resolve catastrophically, but may be more likely to resolve over a long-time through relative price stagnation.
3. US Small Caps: big value in small caps…
US small caps are significantly cheap vs history and cheap vs increasingly expensive large caps. Small caps are also much smaller than usual as a percentage of total US market cap (likewise for mid-caps).
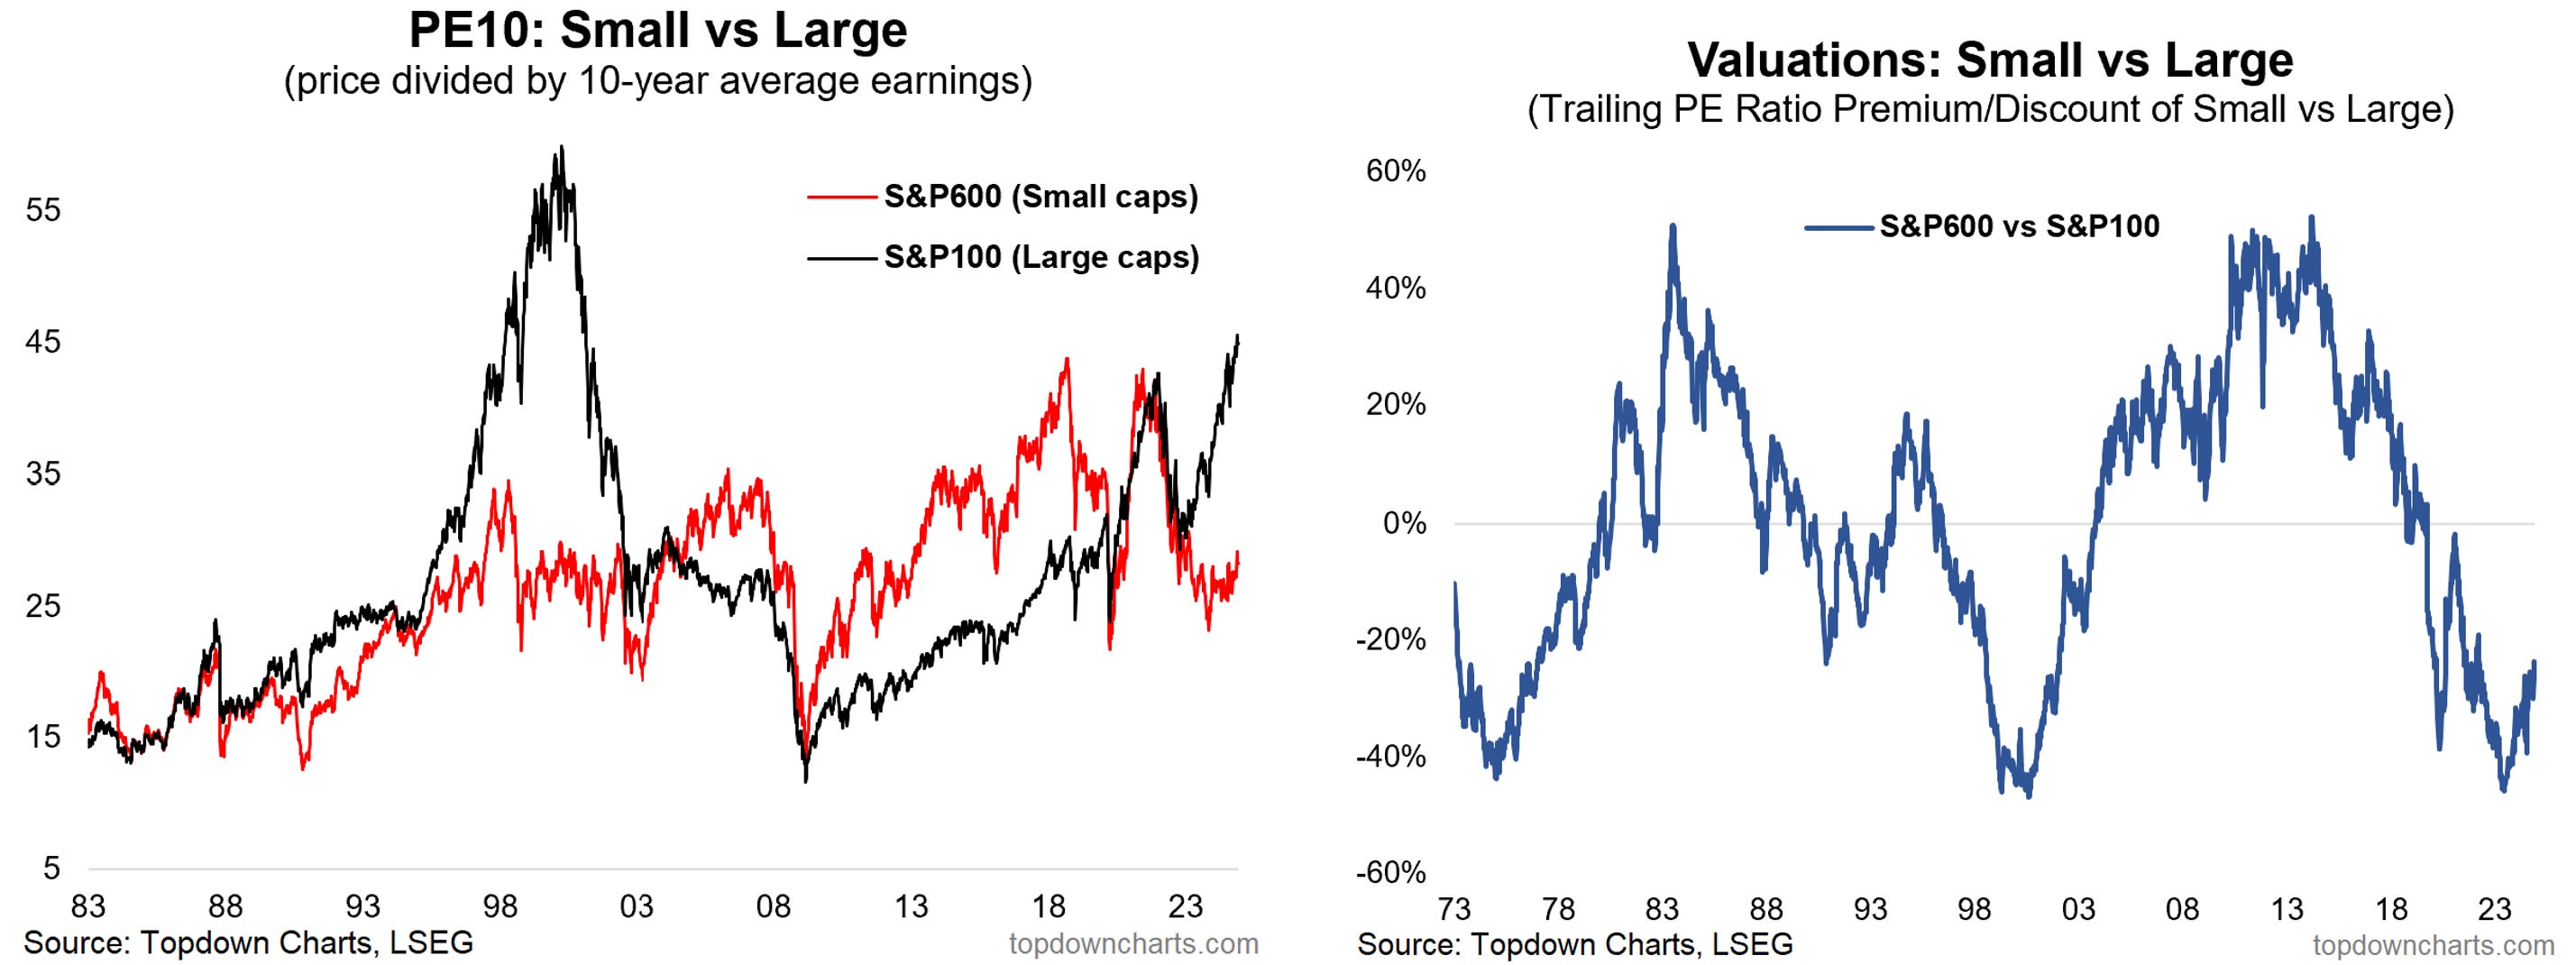
On sentiment, small cap fund flows remain negative, ETF allocations at the low end of the range, speculative futures positioning has squeezed from short to long, but analyst earnings sentiment is neutral to negative. So it is a mixed picture, and arguably with scope for upside surprise.
Sector skews remain a key part of the puzzle here, large caps have just over 50% to tech and tech related, while small caps have well over 50% in old cyclicals (energy, industrials, materials, financials); existing macro themes and/or Trump 2.0 may disproportionately help cyclicals vs tech.
Bottom line: Remain bullish small caps given attractive absolute and relative valuations, mixed-to-negative sentiment and flows, and potential sector skew benefits.
4. UK Equities: mixed picture, not particularly compelling…
UK equities are stumbling off the highs, and earnings revisions momentum look weak. Global investors remain sceptical, with very light allocations.
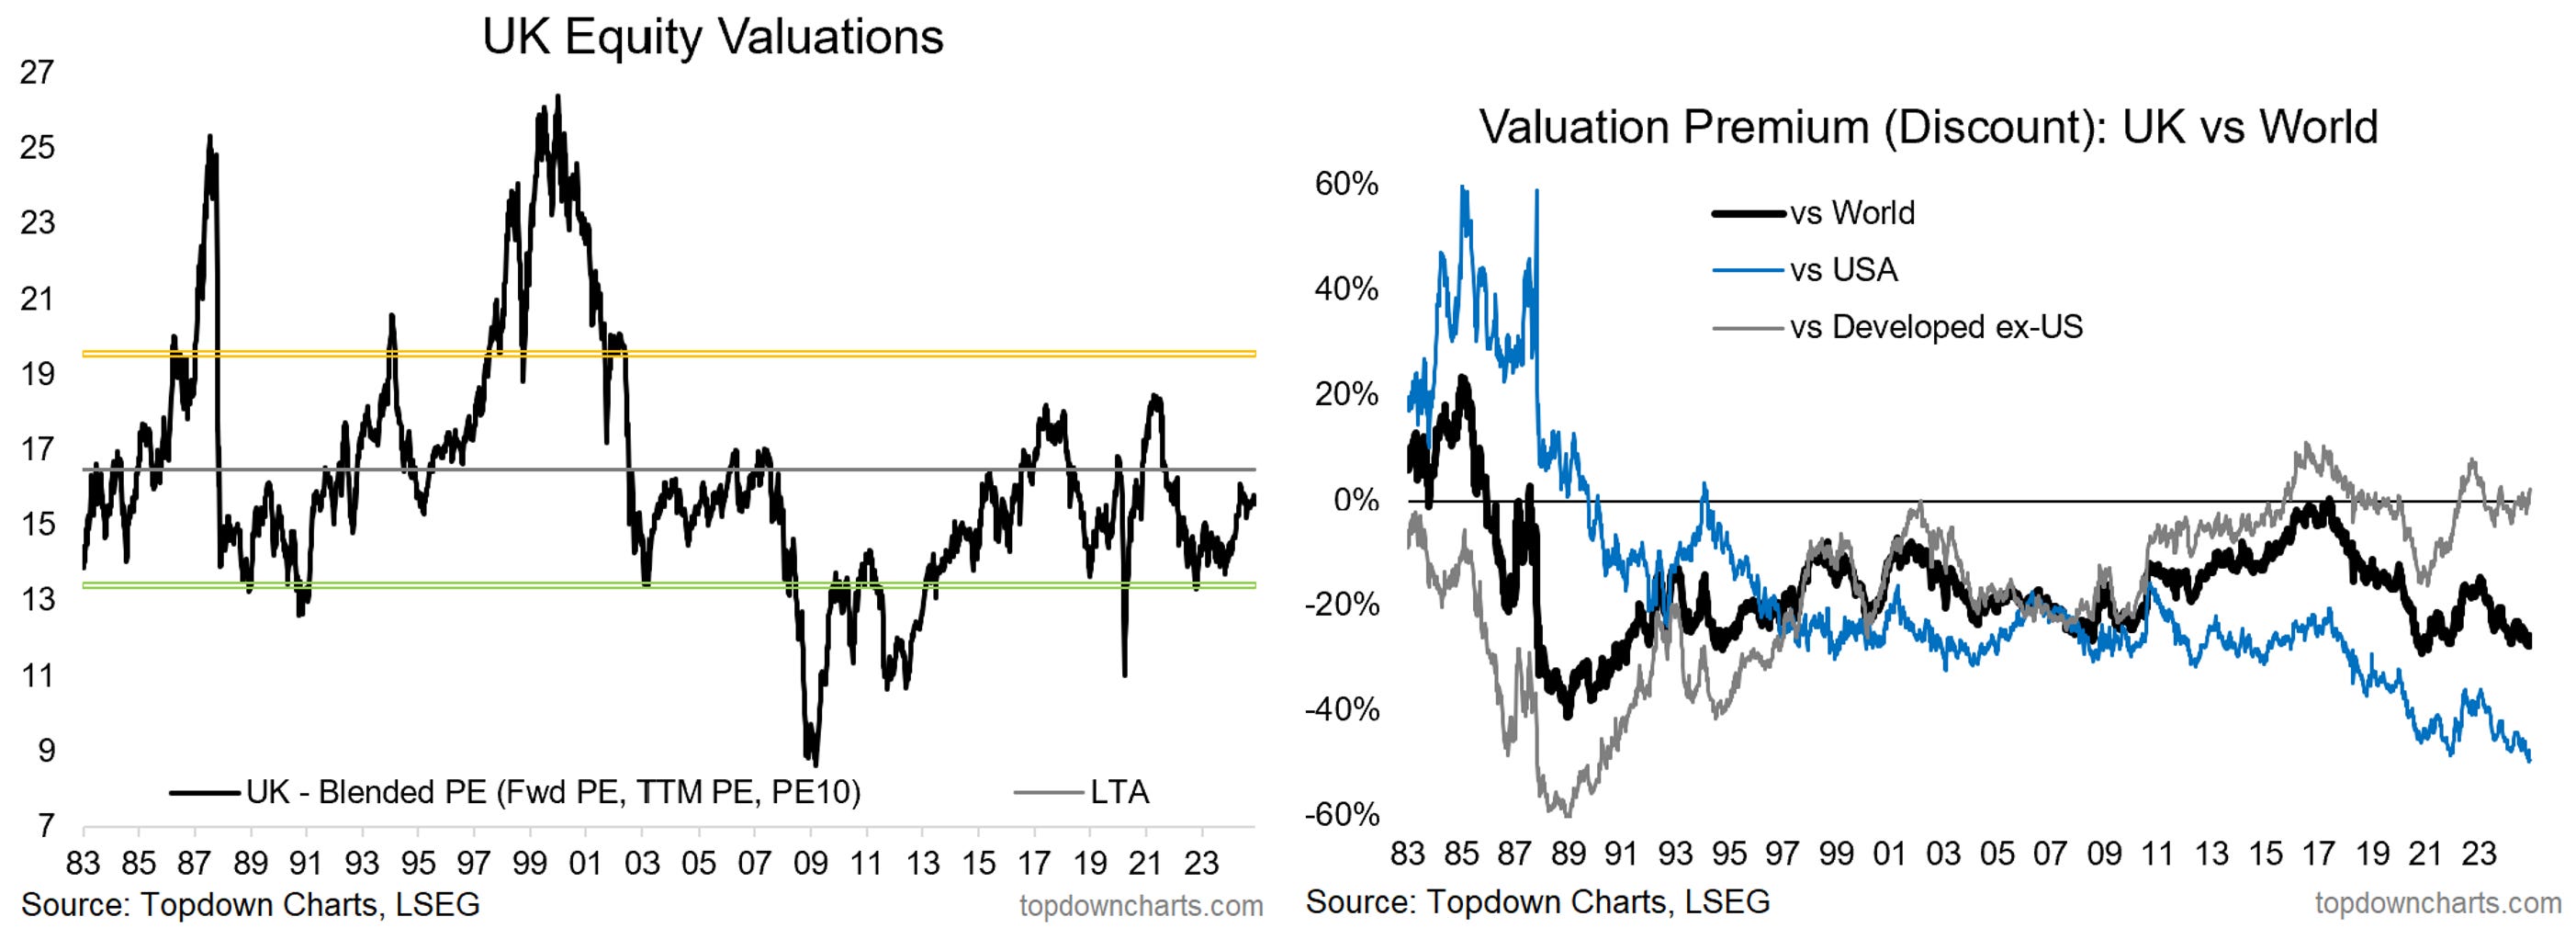
Valuations are not expensive in absolute terms, but notably up off the lows. ERP (relative value vs bonds) is still positive but less-so than the past decade. Relative value vs global looks very good; but this is mostly due to the record discount vs US (thanks to expensive US stocks).
Similarly, the pound is rolling over after a previous short-lived surge in sentiment and speculative longs. Valuations are cheap for GBPUSD (thanks to expensive USD), but the technicals don’t look great; so along with the equities neither look particularly compelling at this point.
Bottom line: Both UK equities and the GBPUSD offer some attractiveness in (relative) value vs expensive US, but the broader picture is not particularly compelling at this point.
5. European Equities: rolling over…
European equities are rolling over off the highs; echoing the peak in sentiment, projected profit margins, and weakening earnings estimates. Economic sentiment remains soft, and thanks to falling inflation the ECB has pivoted sharply into easing, but a key technical level lies in wait for European stocks.
Valuations are similar to UK; not expensive, but pulling back after rebounding materially off previously cheap levels. There is notable relative value vs bonds (but smaller than previous decade average), and substantial relative value vs US as valuation discounts reach new record low extremes.
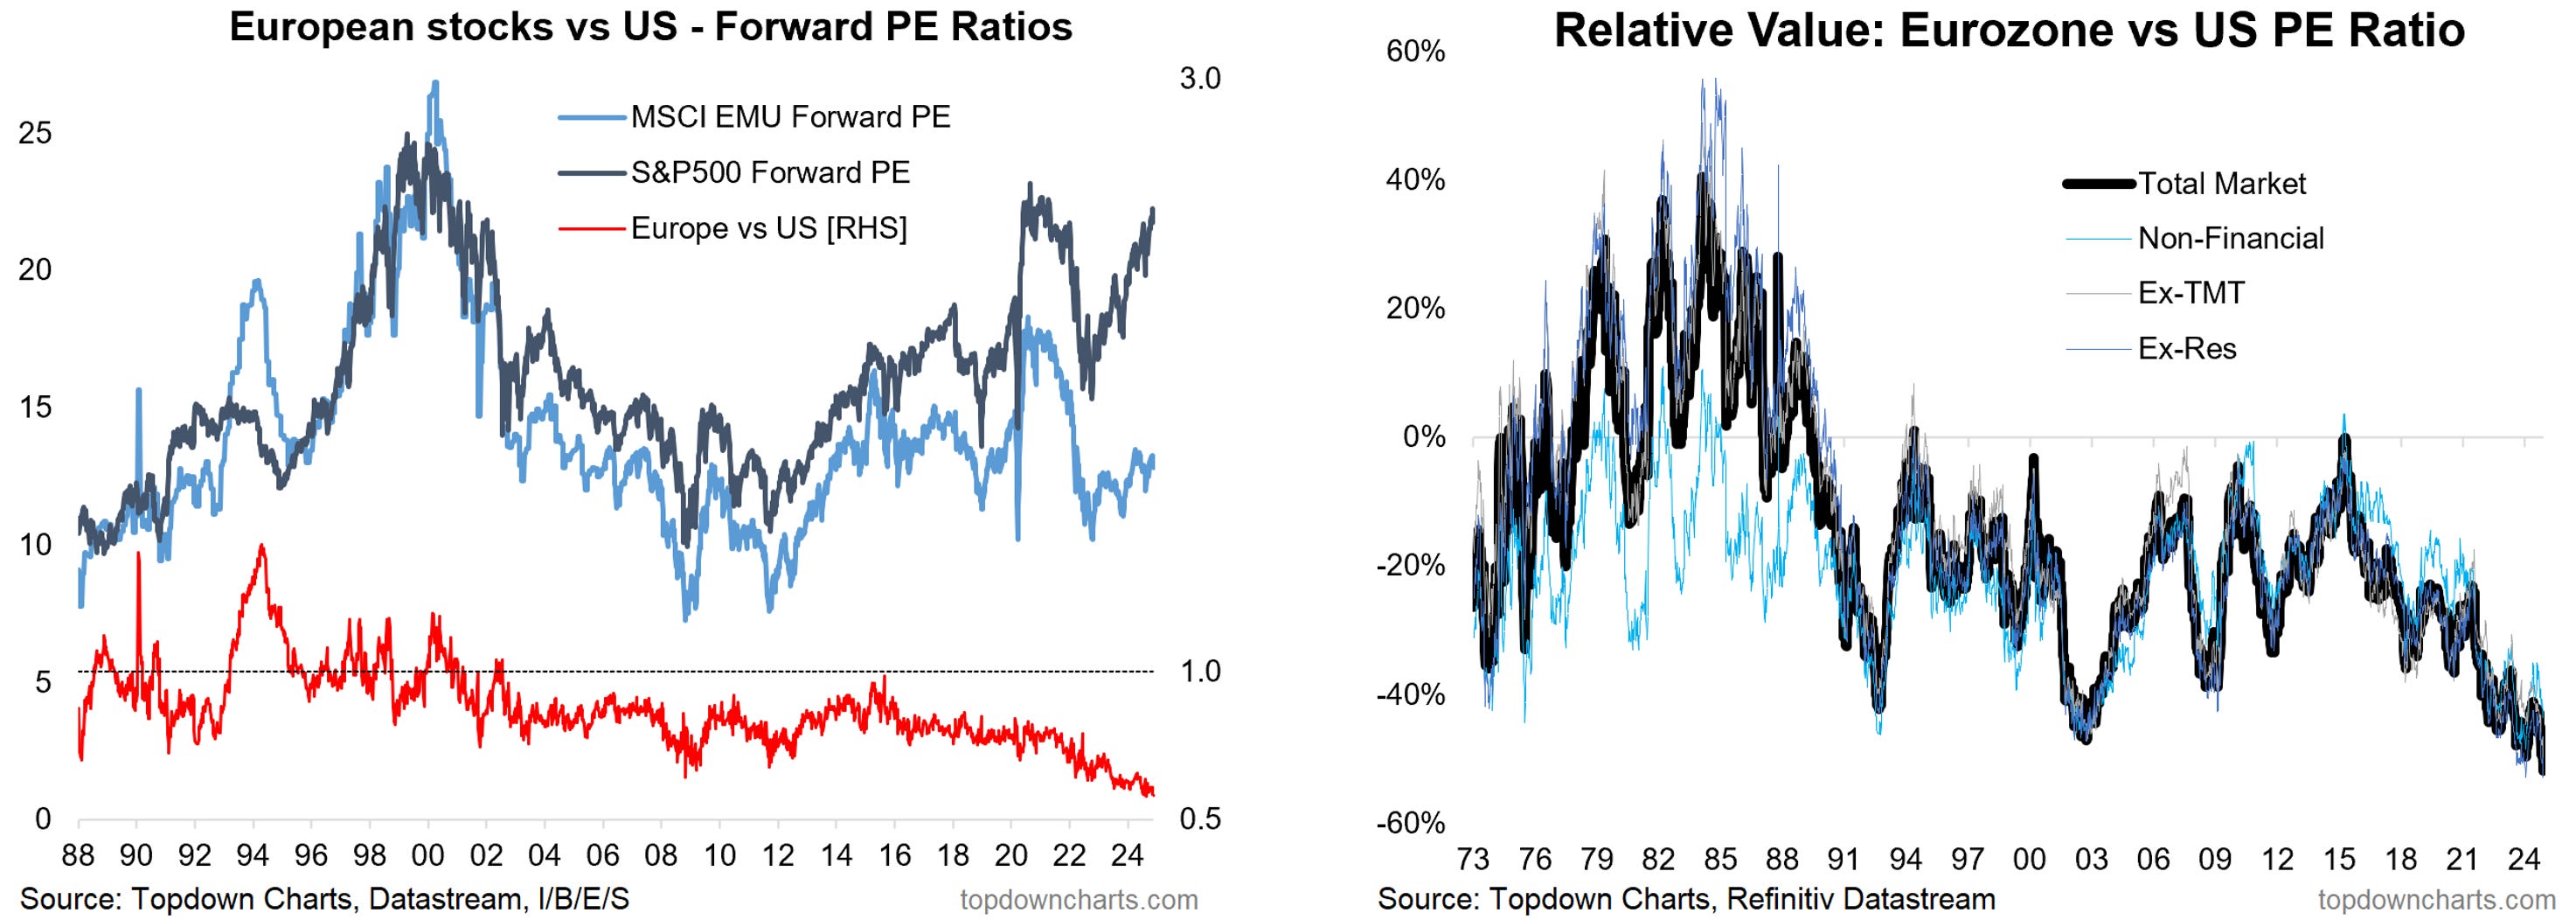
The EURUSD is not much better; positioning reset to slight net-short, valuations still cheap vs expensive USD, but technicals tenuous as the currency pressures a key support level and lingers around the underside of a larger long-term trendline. So while an outright bearish view would be another thing altogether, there is nothing compelling at this moment for either the currency or the equities. And keeping on watch for potential breakdowns.
Bottom line: Similarly, European equities and EURUSD boast cheap relative value vs US, but the technicals and wider setup do not currently look promising, on watch for potential breakdowns.
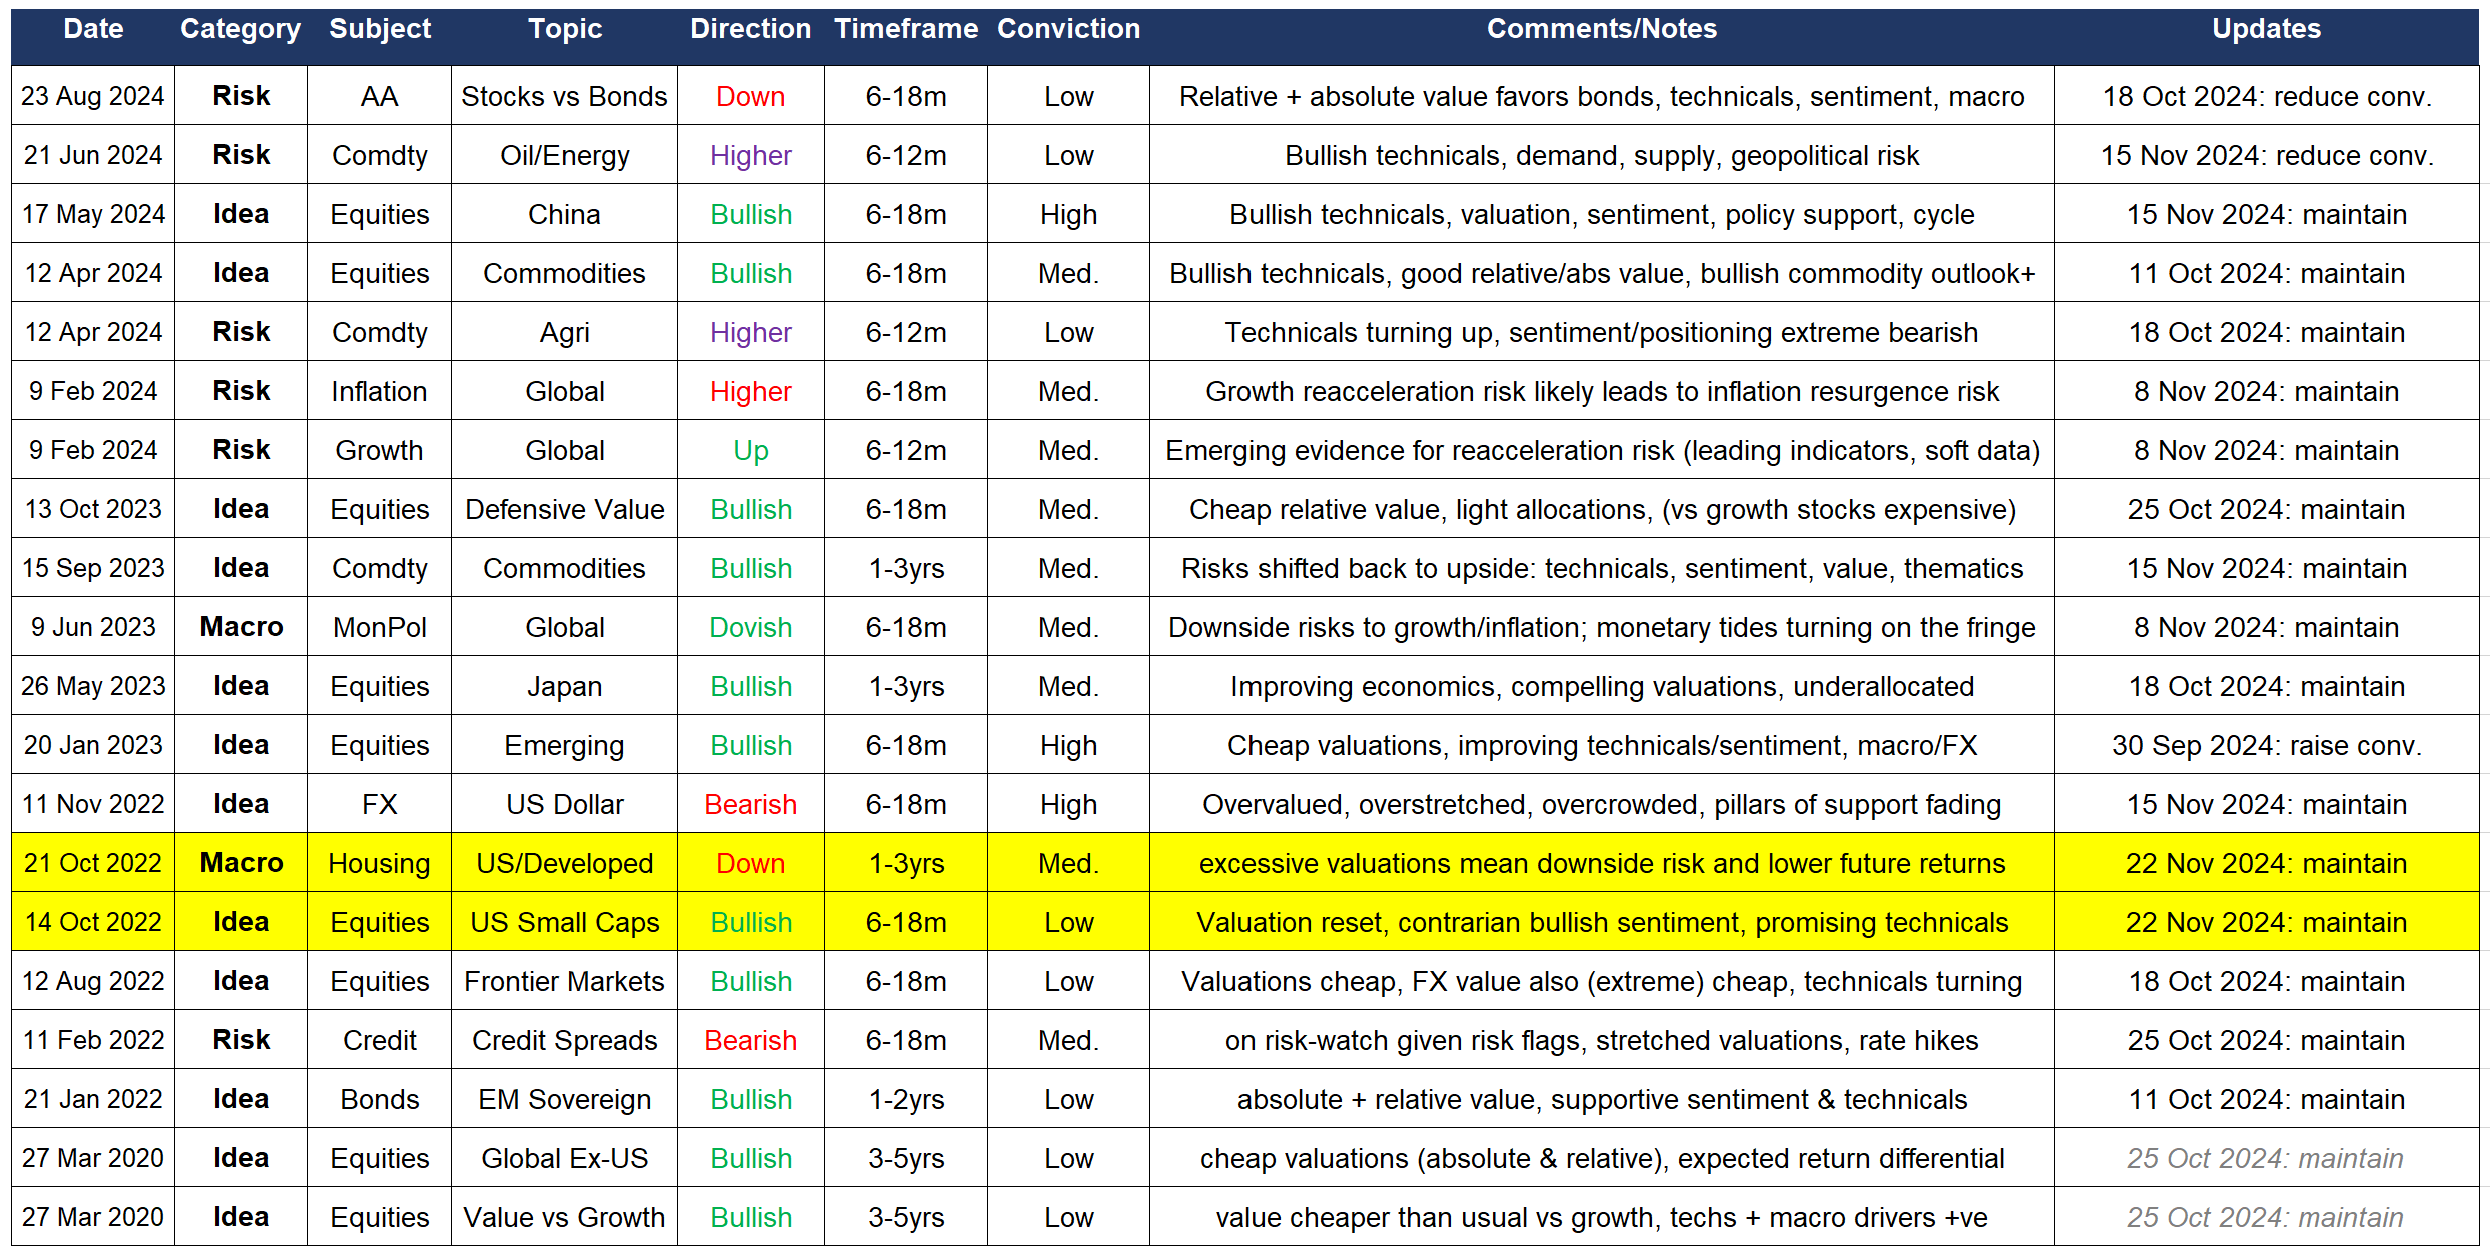
Ideas Inventory - Updated to 25 November 2024
(Current live Ideas/Themes where an explicit view has been issued)
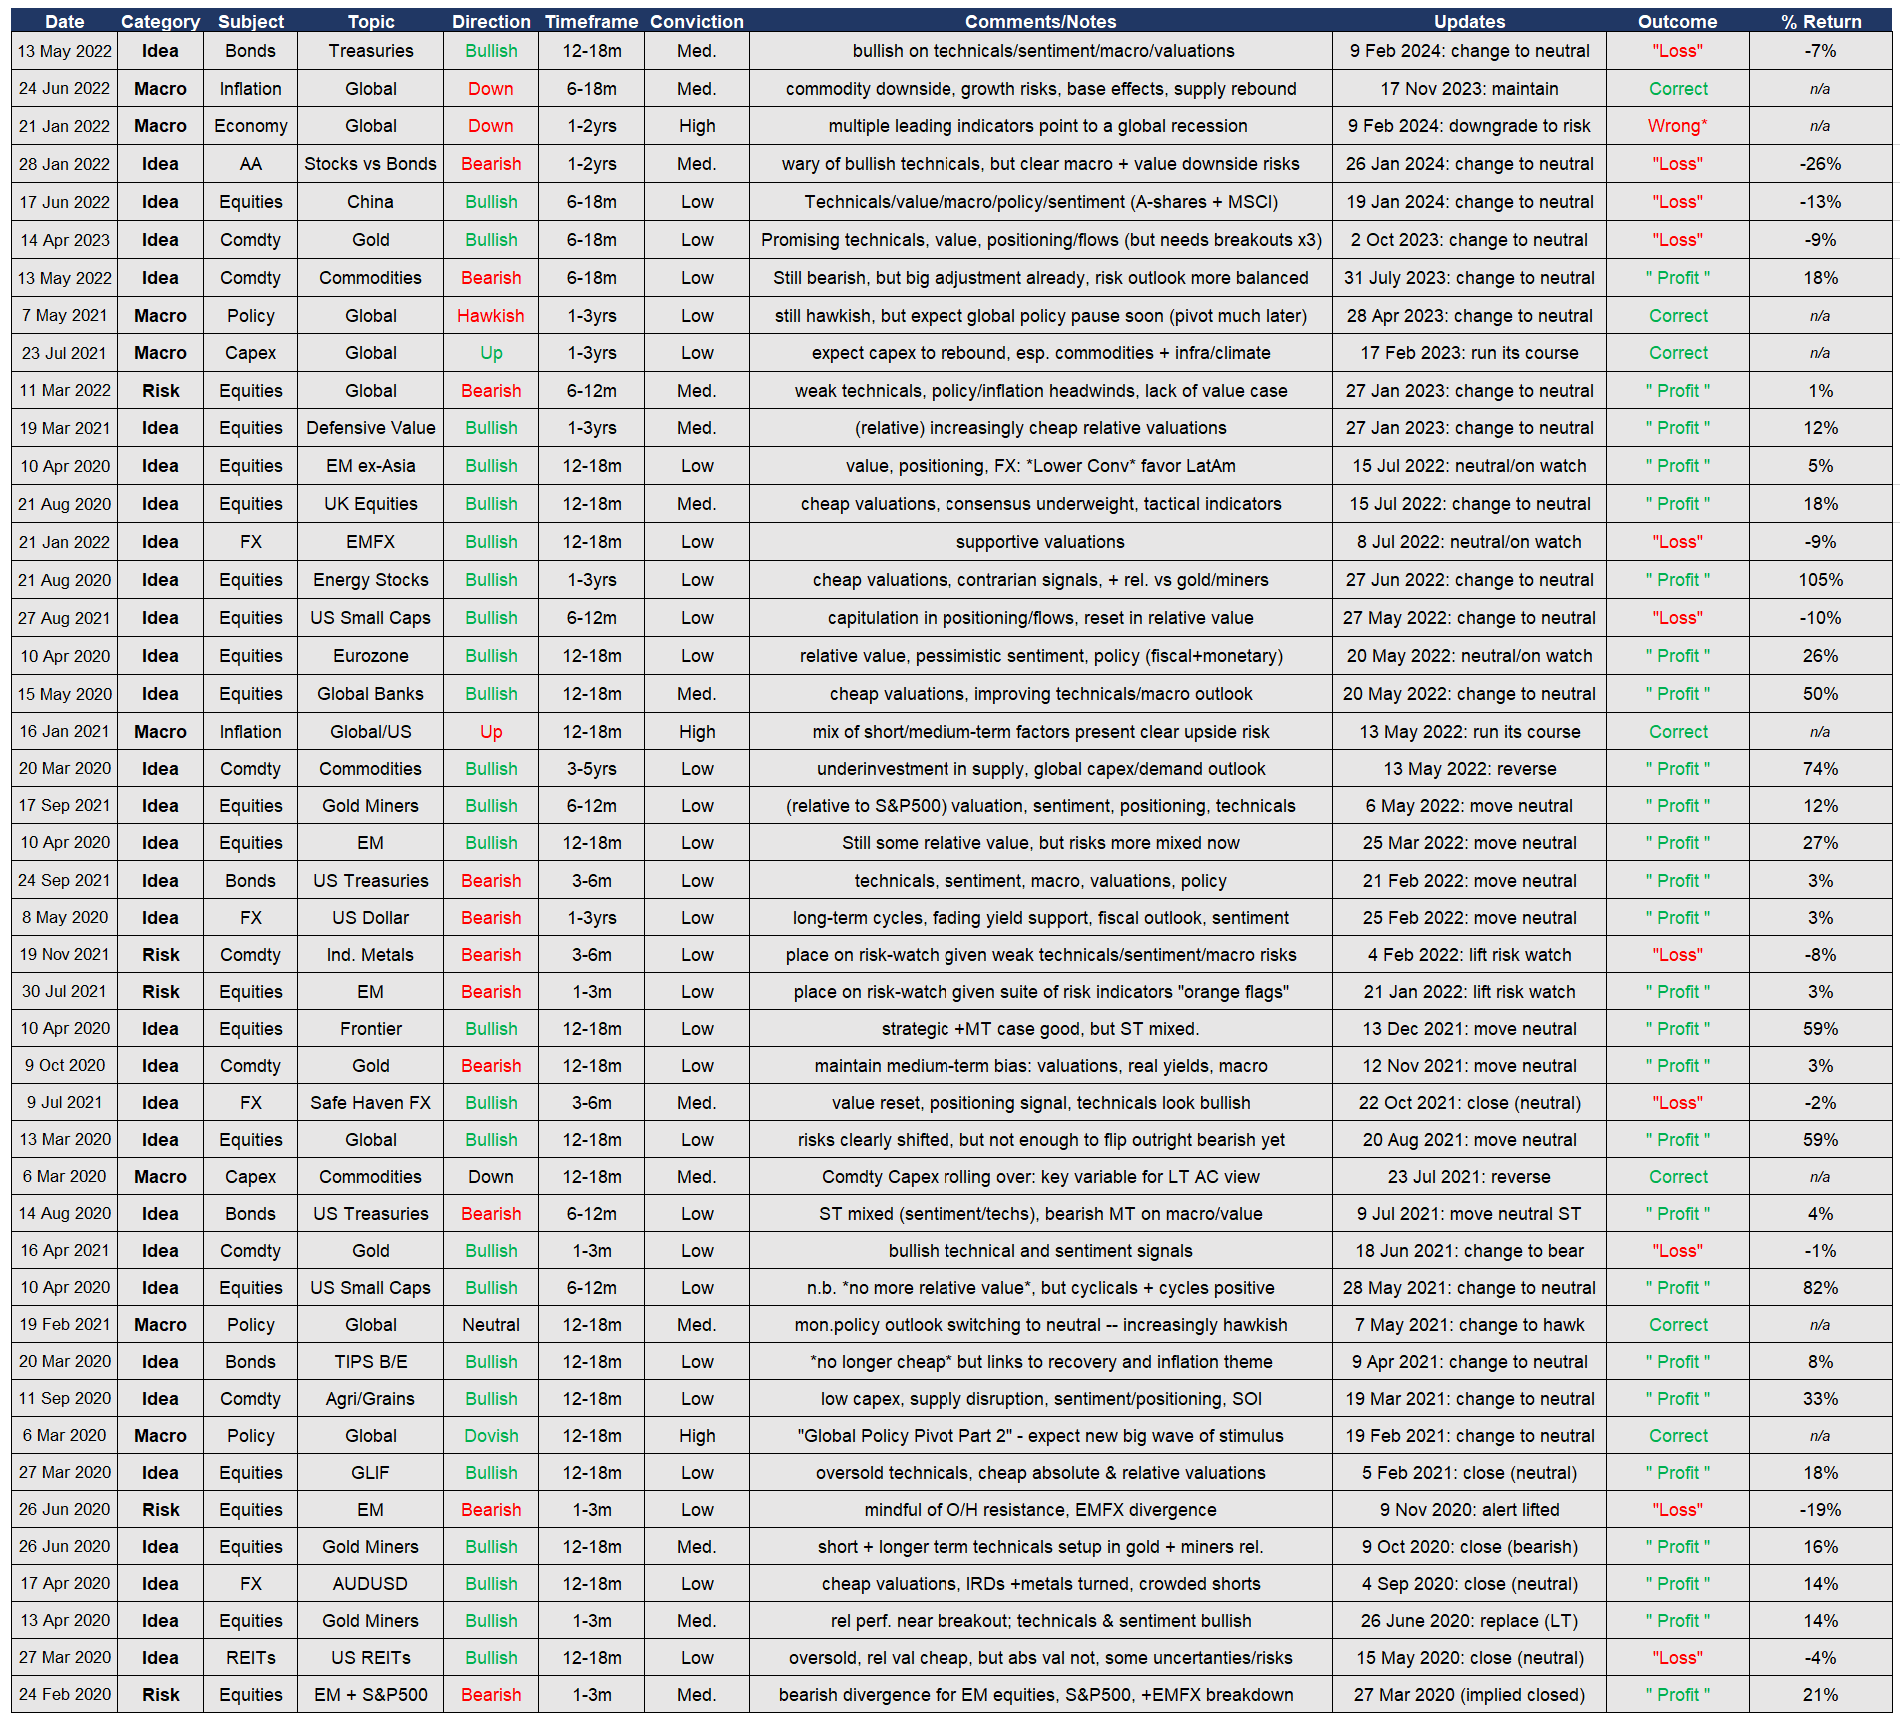
(Closed/Past themes and ideas)
If you haven’t already, be sure to subscribe to this paid service so that you can receive these reports ongoing (along with full access to the archives and Q&A).
Thanks for your interest. Feedback and thoughts welcome in the comments below.
Sincerely,
Callum Thomas
Head of Research and Founder at Topdown Charts
Follow me on Twitter
Connect on LinkedIn
n.b. this is the Topdown Charts Entry-Level service, for the full institutional service see: www.topdowncharts.pro (reply to this email if you’d like a trial)