Weekly Insights - Edition 40
This week: Inflation Outlook, Policy Pivot Progress, Commodities Phase 2, Agri-Commodities, Industrial Metals, EM Sentiment, Bond Yield Breakout
Welcome to the Weekly Insights report!
The weekly insights report presents some of the key findings from our institutional research service, providing an entrée experience (in terms of price and size).
Hope you enjoy it. Let me know if you have any feedback, and by all means don’t forget to tell your friends and colleagues to subscribe :-)
Weekly Macro Themes Report - key points
1. Inflation: Clear near-term upside risk to inflation.
More and more countries are seeing surging inflation rates.
Global supply chain issues remain intense, and are unlikely to disappear any time soon, and thus continue to underpin prices.
Surging inflation rates are triggering a rise in inflation expectations: presenting a risk of a self-reinforcing loop of higher prices, as expectations anchor higher.
Tight labor markets (cyclical, structural, pandemic related) and high realized inflation rates means we likely see upward pressure on wages.
Thus inflation is likely to be underpinned near-term.
However, base effects should see the *rate* of inflation taper off soon, and stimulus removal may also put a dampener on inflation rates further out.
2. Policy Pivot Progress: Monetary tailwinds are transitioning to headwinds.
The barometer smaller/developing country central banks continue to rapidly unwind monetary stimulus, with a slew of rate hikes in January.
Rate hikes are spreading across the rest of the world too, led by emerging markets, but with developed markets increasingly joining in.
As such, the monetary tailwinds that global equities previously enjoyed are steadily being removed: likely soon transition from tailwind to headwind.
Looking at shadow rates (i.e. QE-adjusted policy rates), developed markets have actually effectively delivered a large amount of “rate hikes” e.g. the weighted average shadow policy rate is up +240bps from the low point.
3. Commodities: Gaining a second wind as phase II of the bull market kicks off.
Commodities are gaining a second wind after a period of consolidation post-breakout, with the reset in market breadth/positioning/sentiment clearing the path higher.
The longer-term technicals picture lays out a prospective roadmap for the bull market (e.g. breakout similar to that seen in early-2000, long-term cycle map points to end of decadal bear market).
The technicals are underpinned by the commodity capex depression, which has baked in a multi-year supply tailwind for commodity prices.
Valuations have rebounded significantly, but are yet to probe past peaks and currently present around neutral – so no obstacles there as such.
The link between commodity price growth and the global PMI does speak to potential downside risk if the 2022 growth scare scenario eventuates. However, policy divergence (China easing) may present some offset.
4. Agri-Commodities: Upside risk (based on sentiment/technicals/fundamentals).
Sentiment is surging back to bullish on agri commodities as agri prices find a second wind after a period of consolidation.
Assets in agri commodity ETFs remain in line with average, suggesting that retail punters are not yet on board (source of upside?).
The price action in agri commodity prices shares parallels with the big mid-2000’s breakout, thus there could be much more upside to come.
From a fundamentals standpoint, near-record low rates of capex by food producers, surging fuel and fertilizer costs, and weather issues also present upside risk — and also present a number of parallels with what was seen during the mid-2000’s bull market.
5. Industrial Metals: Risks to the upside (supply/demand tailwinds, China stimulus).
Copper futures positioning/sentiment have reset materially from previous excess optimism, while price has been relatively resilient to the previous/current China macro downdrafts.
The upside of China macro downside is a pivot by the PBOC back to easing (e.g. back to back rate cuts in Dec/Jan). Thus previous China monetary headwinds to industrial metals may soon turn to tailwinds.
Supply remains very tight, with rates of capex still well below average, and below the lower end of the historical range, meanwhile, inventories have been run down to decade lows across industrial metals.
A possible cyclical uptick from China easing, structural demand tailwinds from electronic vehicles and climate investment, set against that supply backdrop likewise present parallels to the mid-2000’s big breakout.
Global Markets Monitor - notable developments
Price: EMFX/commodities/global equities saw stronger breadth last week, while risk pricing breadth relaxed slightly. Equity markets saw mostly modest gains, with the S&P500 rallying to recapture the 4500 level, while the Dow and Nasdaq similarly put in small gains. Global equities are seeing consolidation across sectors following the rapid rotation from growth to value over the last couple of weeks.
Treasury yields ended sharply higher across the board last week as the US 10-year broke through the 1.9% level. The 10-2 year spread has come down somewhat with the rise in yields. US IG/HY spreads have been edging higher, with similar sort of action happening to Europe HY spreads. Meanwhile, real yields are heading higher across developed markets.
On the FX front, the DXY is retreating after the attempted breakout falling back to the mid-95 range. Elsewhere in FX, EURUSD is moving lower and USDBRL is on the move as BRL gains from recent rate hikes. Commodities are showing further strength with WTI crude making a tentative break higher into the 90s now consolidating above $90 per barrel. Gold and silver both managed to bounce off support last week with livestock also making a move higher.
Sentiment: Bond sentiment has moved further net-bearish as bonds break down and yields rise. Elsewhere, EM sentiment is ticking up after a reset to neutral.
Market Themes: US 10-year treasury yields are breaking higher, and they are not alone. We are seeing widespread weakness across global sovereign bonds (e.g. one of the highest ever readings of the composite breadth indicator which tracks the z-scores of the proportion of 10yr yields above their 50 and 200 day moving averages and 52wk new highs minus new lows).
Real yields are also on the move, ticking higher across DM with US real yields, in particular, looking close to breaking out. As noted a couple of weeks back there is a window of prospective further weakness for bonds. We could easily see UST 10-year yields head back above 2% in the short-medium term. If this is driven by higher real yields (which seems likely - and is what we are seeing so far) that would put further pressure on long-duration equities and fixed income.
On the Radar
Macro & Markets: On the radar, this week is the US NFIB, CPI numbers, and the University of Michigan consumer sentiment index. Elsewhere, there’s the much-watched money/credit data due out of China.
In markets, the UST 10-year yield is breaking higher as it pushes above 1.9%. Similarly, with WTI crude, prices are pushing higher with the cost per barrel moving into the $90s. The DXY is whipsawing all over after coming back down after a failed attempt on resistance. Elsewhere, gold is bouncing off support and stocks are chopping around near support — still looking fragile.
Research Agenda: This week I’ll be digging deep into credit, updating my models; asking the question if it’s a short/underweight yet (current view is neutral - leaning bearish). Other than that, I’ll also be going through regional/country equity charts to review the allocations within global equities.
Top Charts of Topdown
Here’s a selection of charts that I thought were particularly notable.
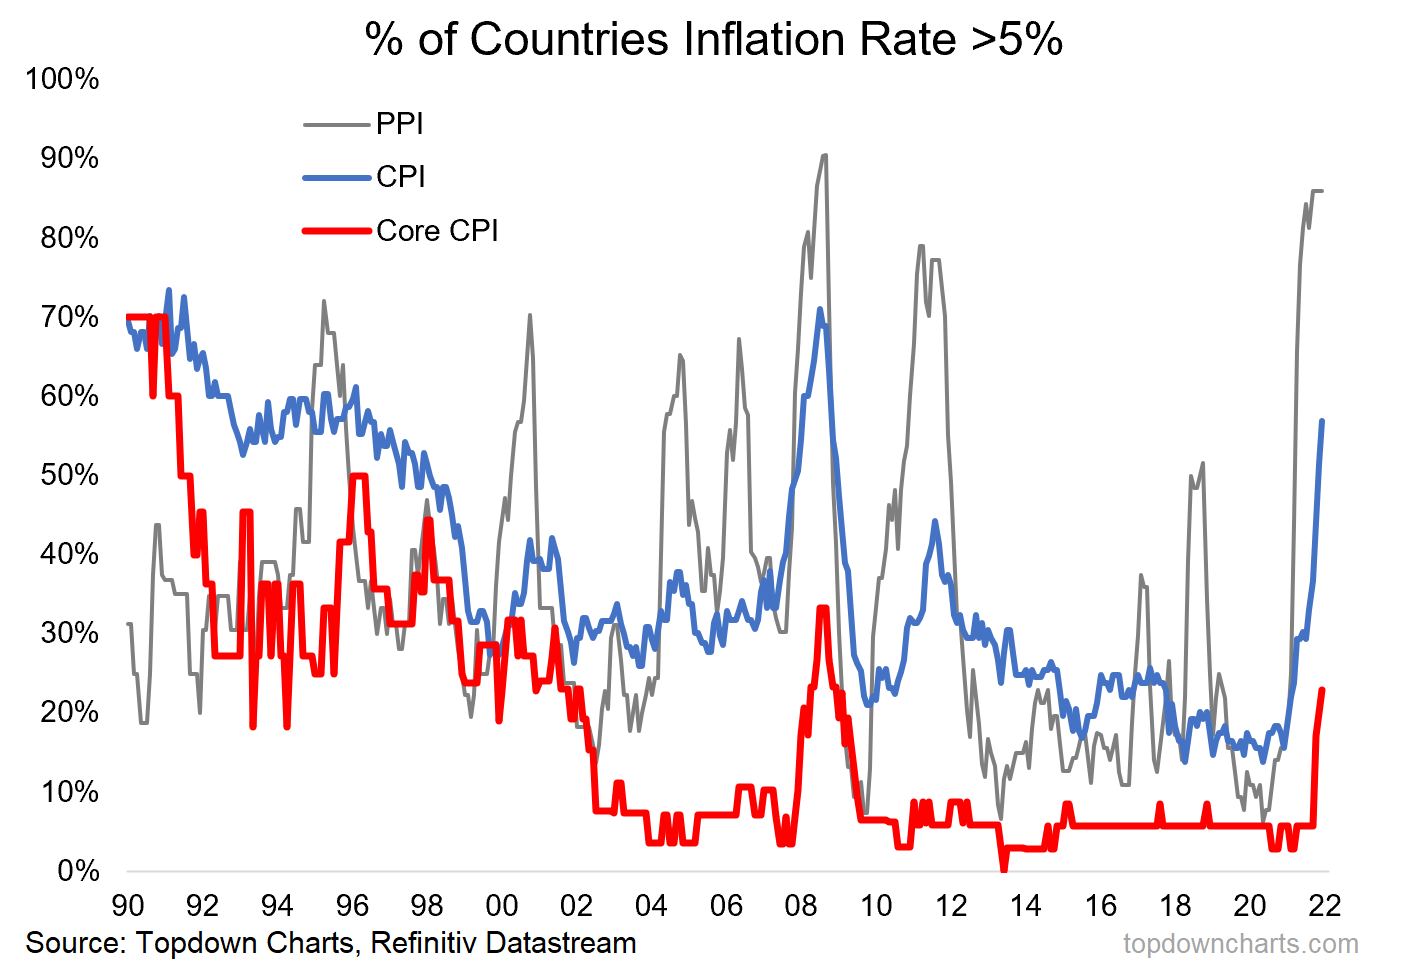
1. Inflation breadth: The chart below highlights the current widespread nature of inflation globally. The chart tracks the proportion of countries tracked seeing annual inflation rates above 5%. Looking at producer price inflation, nearly 90% of countries now have a PPI inflation rate above 5%. Consumers are inevitably affected as well with over half of countries seeing CPI inflation above 5%.
Notably, even core inflation is elevated, with more countries seeing higher core CPI inflation than at any other time in more than a decade: 25% of countries are now recording core CPI above 5%. It’s this type of widespread creeping inflation that has pushed inflation expectations higher and impacted on inflation sentiment.
Key point: Inflation rates are accelerating globally.
2. Shadow Policy Rates: Shadow policy rates factor in the effect of quantitative easing (QE) to determine an adjusted/effective rate. Comparing the shadow policy rate with the standard policy rate we can see that below the surface the story is wildly different both with regards to previous easing, and now tightening...
Indeed, looking at the Developed Markets weighted average shadow policy rate we can see they have actually gone up +240bps from the low point. Hence in this respect it was only a matter of time before the vertical run in equities came to a pause.
It’s likely that we see this indicator move higher yet as QE programs are increasingly being halted, bond markets are adjusting upwards, and even headline policy rates are starting to be hiked in DM (e.g. UK, Norway, NZ already, and the Fed, BOC soon). Thus as noted earlier, monetary tailwinds are transitioning to headwinds.
Key point: The risk/return balance for equities has shifted as shadow rates rise.
3. Commodity Capex Tailwinds: This chart shows the stark extent of the commodity capex depression that has developed in recent years in the wake of the commodity bear market and pandemic panic. Multiple obstacles have been imposed on the commodity producer sector to prevent the usual supply response (pandemic disruption, uncertainty, initial credit crunch and commodity crash).
But even so, the supply response by commodity producers tends to come with a lag (lead-times in decision making, funding, execution). Ironically, the supply response will also bring with it increased demand for commodities as part of the process of actually executing on bringing supply to market (i.e. demand for machinery/equipment, energy, etc). So it seems fairly clear that there is a multi year capex tailwind baked in for commodities.
Key point: The capex depression means multi-year tailwinds for commodities.
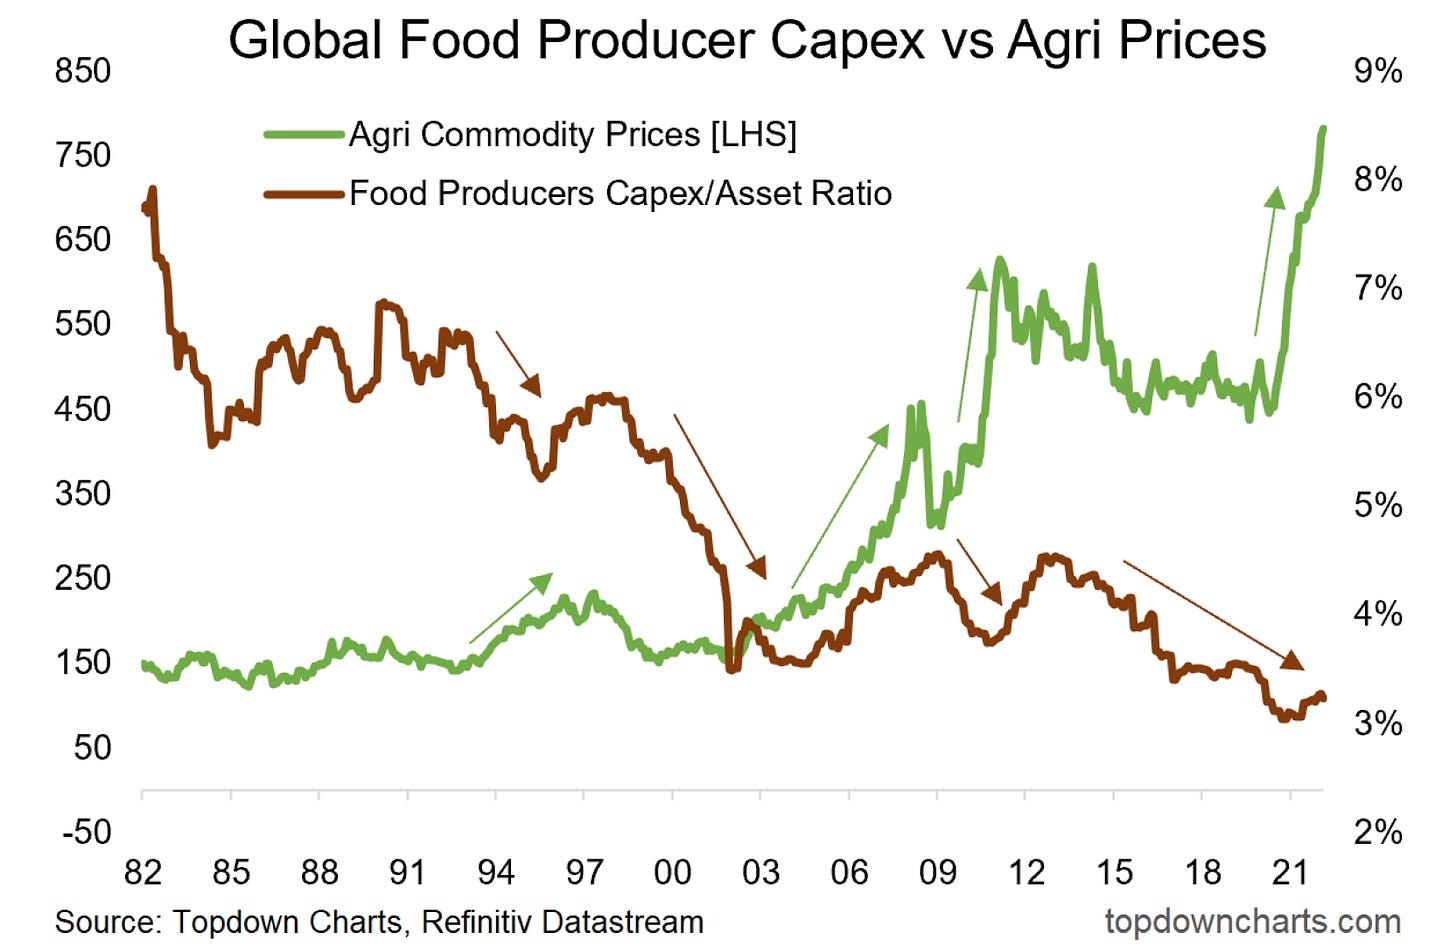
4. Global Food Producer Capex vs Food Prices: On a very much related note, and we see this across commodities, global food producer capital expenditure also remains near record lows after years of stagnation. Historically this kind of run-down in capex sows the seeds for higher prices.
But again, as noted, this is similar to what we saw in the early 2000’s. We also saw rising input costs, weather volatility, and a major technical breakout just like what we are seeing now. So even though the run in agri prices has already been substantial, there could be further upside to come.
Key point: Agricultural commodity prices may have further upside yet.
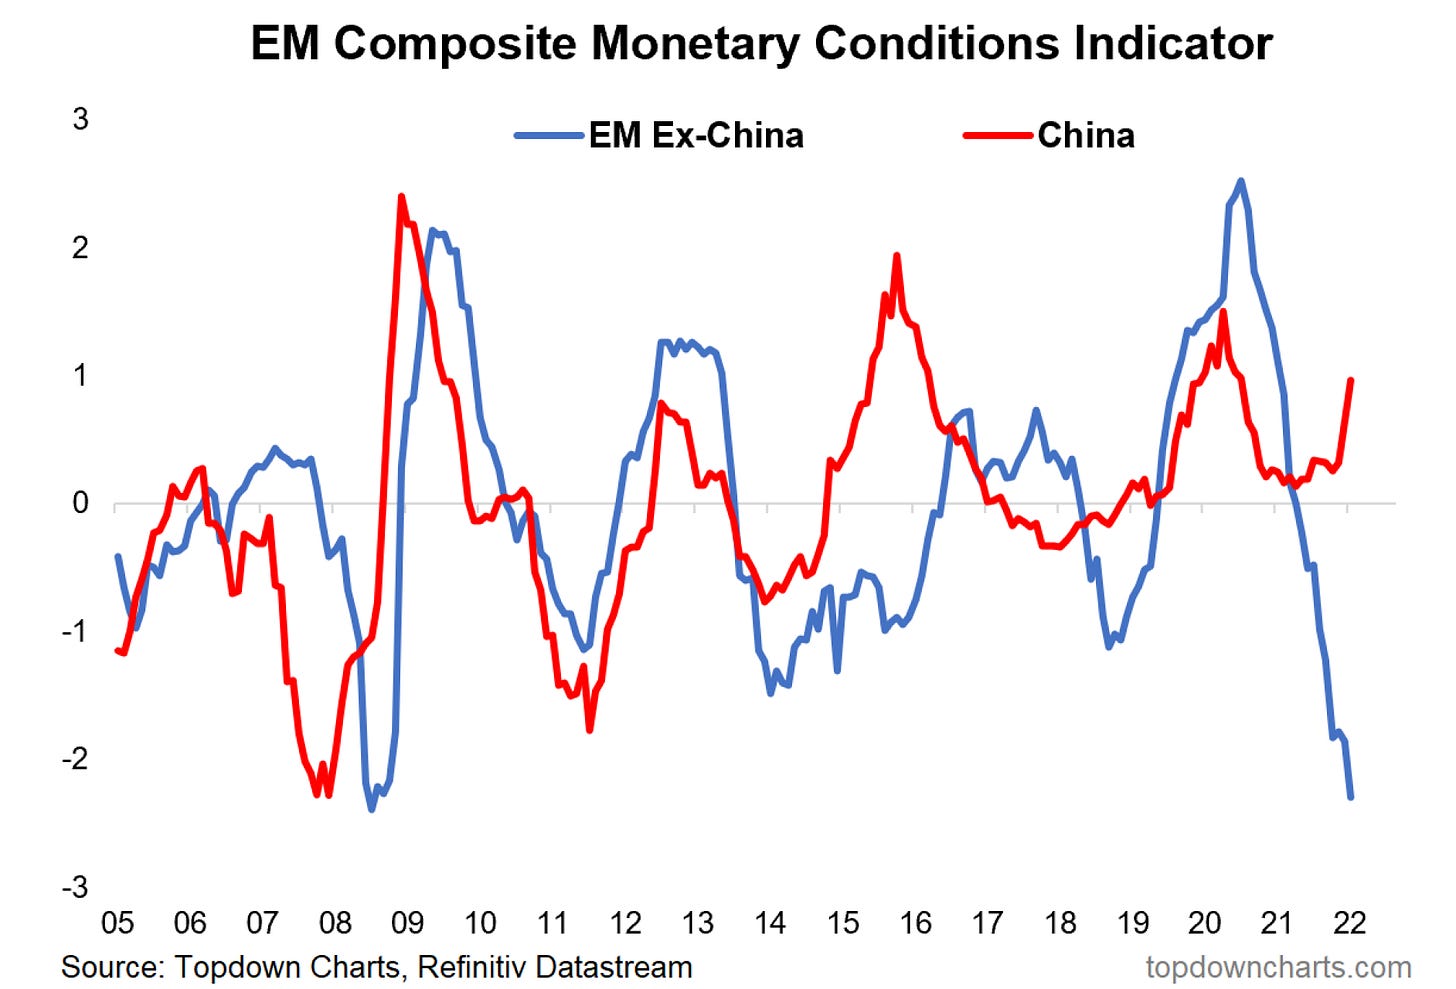
5. PBOC Policy Pivot: While most of EM (and most of DM for that matter) shifts to tighter monetary policy, the PBOC has undergone a pivot back to policy easing. The Chinese property market’s deepening downturn, covid resurgence and general macro downdrafts, plus this year being basically an election year for Xi Jinping means further easing is likely on the cards.
The chart below shows the divergence that’s already underway with China pivoting while the rest of EM continues to tighten. As the trend continues expect the headwinds for commodities, and industrial metals in particular, to fade and transition to tailwinds supported by looser monetary conditions in China.
Key point: China is pivoting to easing, just as EM tightening reaches extremes.
Ideas Inventory - Updated to 4 February 2022
(Current live Ideas/Themes where an explicit view has been issued)
If you haven’t already, be sure to subscribe to this paid service so that you can receive these reports ongoing (along with full access to the archives and Q&A).
Thanks for your interest. Feedback and thoughts welcome in the comments below.
Sincerely,
Callum Thomas
Head of Research and Founder at Topdown Charts
Follow me on Twitter
Connect on LinkedIn


