Chart of the Week - Big Breakdown in China
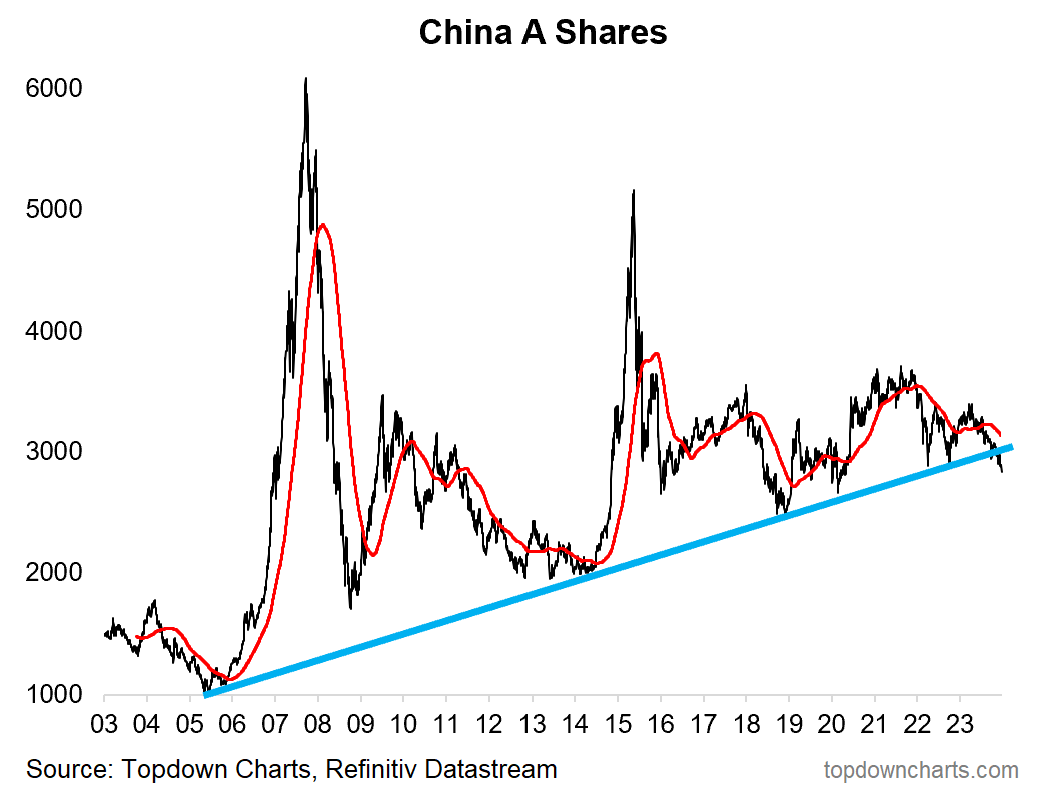
Chinese A Shares have broken through a key long-term support line...
Chart of the Week - The Trouble With Chinese Stocks
Chinese Equities are breaking down, and that’s a big deal because the drivers behind this move matter immensely for global markets, and the global economy.
Firstly, in terms of what has happened, China A shares have broken down through their long-term uptrend line (chartists will also point out an apparent head and shoulders topping pattern).
When it comes to technical analysis, the more you zoom out the more significant a certain development is. And so when you have such a long-standing support line like this getting broken, you have to pay close attention.
As for the why, China’s economy is currently facing multiple challenges: the property market is in an entrenched 2-year+ downturn, global trade and manufacturing are recessionary (thanks partly to the post-pandemic inventory cycle), growth remains in a structural slowdown, and consumer confidence is depressed.
Normally that bad news would be good news, but the game has changed.
In the past such a backdrop would mean big bang stimulus, but this time around the government has opted for a more measured and incremental approach — preferring to attempt to deflate past bubbles rather than blow new ones.
Given the lack of a stimulus-savior, the earnings/macro is thus writing the script for stocks and hence why we see the current technical breakdown.
Aside from being bad news for the stocks, it’s bad news for the global economy - as China faces inwards and focuses on restructuring vs reflating. This is why I talk about China as a key wildcard in the macro edge risks for 2024 i.e. the edge scenarios of recession and deflation vs reacceleration and inflation. If China stimulates it’s the latter, if China stagnates it’s the former. For now markets are telling us we’re on track for the former.
In 2024 macro and markets, the year of the dragon, keep an eye on China.
Key point: China A shares have broken down through a key long-term support line.
HELP!
I need a small favor — if you use LinkedIn and/or Twitter(/X), can you please log on and share/like/retweet/repost my 2024 Charts post (links below) to help get a little more exposure? (these days it’s tough to get exposure with the constantly changing social media algorithms!)
Twitter(/X): https://twitter.com/Callum_Thomas/status/1746951393041367246
Thank you!
Topics covered in our latest Weekly Insights Report
Aside from the chart above, we looked at several other charts, and dug into some intriguing global macro & asset allocation issues on our radar:
Equities: strong spots, weak spots, and in-between spots
Credit: new lows for Europe and EM (complacency?)
Defensive Stocks: a compelling contrarian bullish setup
Quarterly Pack highlights: key points for the 2024 outlook
Macro Risk Radar: key data and market developments to watch for
Subscribe now to get instant access to the report so you can check out the details around these themes, as well as gaining access to the full archive of reports.
For more details on the service *check out this recent post* which highlights:
a. What you Get with the service;
b. the Performance of the service (results of ideas and TAA); and
c. What our Clients say about it.
But if you have any other questions on our services definitely get in touch.
Thanks for your interest. Feedback and thoughts welcome.
Sincerely,
Callum Thomas
Head of Research and Founder at Topdown Charts
Follow me on Twitter
Connect on LinkedIn


