Chart of the Week - Commodity Season
Did you forget this asset class? (pretty much everyone else did!)
Commodities have become a forgotten asset class — they fell into a cyclical bear market after peaking back in 2022, and with other assets faring much better I guess it kind of makes sense that investors have begun to ignore this corner of the market.
But things are changing and it’s time to remember commodities, because commodities will remember us!
First, straight into the chart: it shows the historical seasonal pattern of commodity prices (diversified GSCI Light-energy index) and WTI crude oil.
More to the point: it’s showing a seasonal tendency for strength in H1 for commodities — this is a big deal for a couple of reasons...
And before you go on about the fallibility of seasonality (and it is fallible, doesn’t always work, with many exceptions to the rule), just remember; in commodity markets seasonality isn’t just fun with numbers it’s real physical changes in the natural world and real shifts in supply and demand. So you tend to give it a bit more weight than say stock market seasonal trends.
That all said, we pay much more attention to seasonality when it confirms or lines up with an existing thesis and thus serves to build conviction, and I would have to say that my conviction in the bull case for commodities is building.
As a quick overview: my indicators show commodity valuations are cheap, technicals are improving (breadth turning up from oversold, the index is close to a major breakout), intermarket indicators are supportive (commodity/gold ratio ticking up + gold strength leading commodities), the cyclical demand outlook is supportive (China rebound + stimulus, Europe rushing rate cuts, US strong as ever), supply growth is constrained (decade of weak capex by commodity producers), and along with bullish seasonality there appears to be a new multi-year upcycle underway.
We need to remember commodities in this context — even if you don’t or won’t invest in them because a surge in commodity prices is going to present upside risk to inflation (remember inflation? —p.s. see bonus chart below on inflation)
So: don’t forget this intriguing and important asset class because things could get very interesting this year…
Key point: Commodity prices have a seasonal tendency to rise from Jan to June.
Speaking of commodities…
Make sure you head over and check out my new Monthly Gold Market Chartbook — in particular you are probably going to want to sign up for the [free] “GoldNuggets Digest“ (which is a weekly selection of charts on gold, precious metals, miners, and macro) go git it!
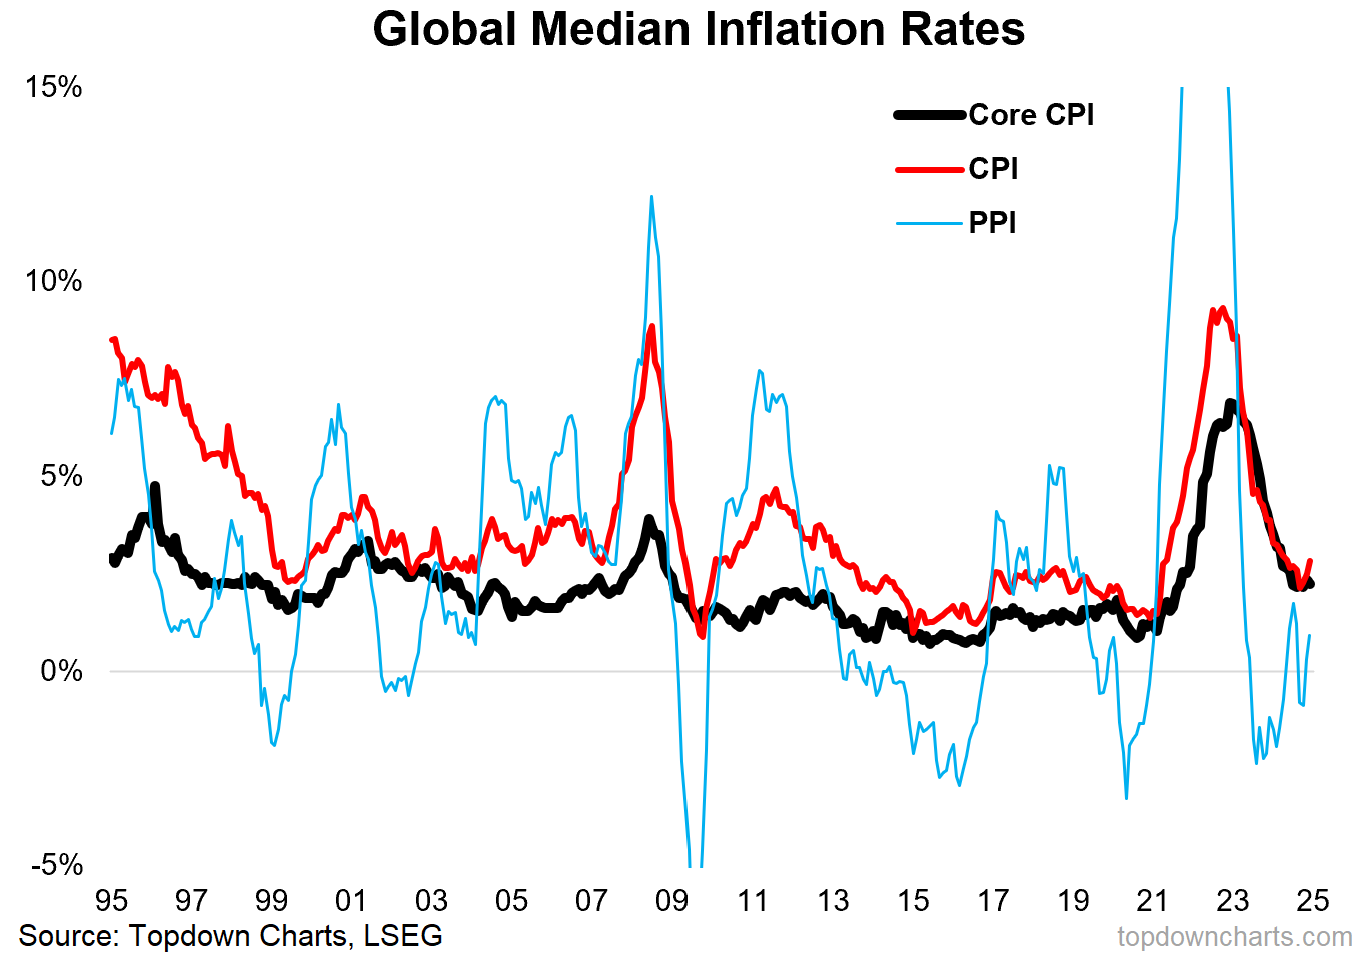
Bonus Chart: As noted, the setup I just outlined above if it comes to pass will present near and pressing upside risk to inflation… and that will come at a time where global growth reacceleration risk is starting to become a reality + as the chart below shows the Great Disinflation has stalled.
I don’t think we get a repeat in magnitude of the 2021/22 surge in inflation, but we are clearly into the higher-for-longer rate of inflation timeline, and that’s going to have important implications for the path of monetary policy, bond yields, and ultimately both yield sensitive assets and the stockmarket as a whole if things end up getting disruptive.
So I am advocating a cautious stance on equities given they are so overvalued, a cautiously optimistic stance on bonds (they are cheap), and a highly bullish stance on commodities as a key way to both hedge and participate in this theme.
Topics covered in our latest Weekly Insights Report
Aside from the chart above, we looked at several other charts, and dug into some intriguing global macro & asset allocation issues on our radar:
EMFX Risks: key charts and indicators we are monitoring
China Macro: things are turning the corner, key development
Commodities: bull case is strengthening
Commodity Equities: interesting technicals, relative strength
Oil & Energy Stocks: risks, opportunities, and hedges
Agri Commodities: the shifting risk outlook, macro implications
Subscribe now to get instant access to the report so you can check out the details around these themes, as well as gaining access to the full archive of reports.
For more details on the service *check out this recent post* which highlights:
a. What you Get with the service;
b. the Performance of the service (results of ideas and TAA); and
c. What our Clients say about it.
But if you have any other questions on our services definitely get in touch.
Thanks for your interest. Feedback and thoughts welcome.
Sincerely,
Callum Thomas
Head of Research and Founder at Topdown Charts
Follow me on Twitter
Connect on LinkedIn
NEW: Other Services by Topdown Charts
Weekly S&P 500 ChartStorm —[US Equities in focus]
Monthly Gold Market Pack —[Gold charts]
Topdown Charts Professional —[Institutional Service]


Some commodities are already turning higher, notably precious metals (both gold and silver) and some soft commodities such as coffee, cocoa, dairy products and some meat and cooking oils. At this stage, we haven't seen a lift in wheat, but corn is looking more solid. Industrial commodities connected to China remain subdued, as does energy. But for industrial commodities in supply deficit such as copper and platinum, it wouldn't take much to shift their price momentum higher.
It looks like commodities are still waiting for more China stimulus to be confirmed (and approved by the market). When I see the commodities index it looks a lot like the HSI technical pattern.
So…there is value and the macro story seems to be going to the right direction, we
just have to wait for the final trigger (or buying the dips, depending on your style 😂)