Chart of the Week - Global Policy Pulse
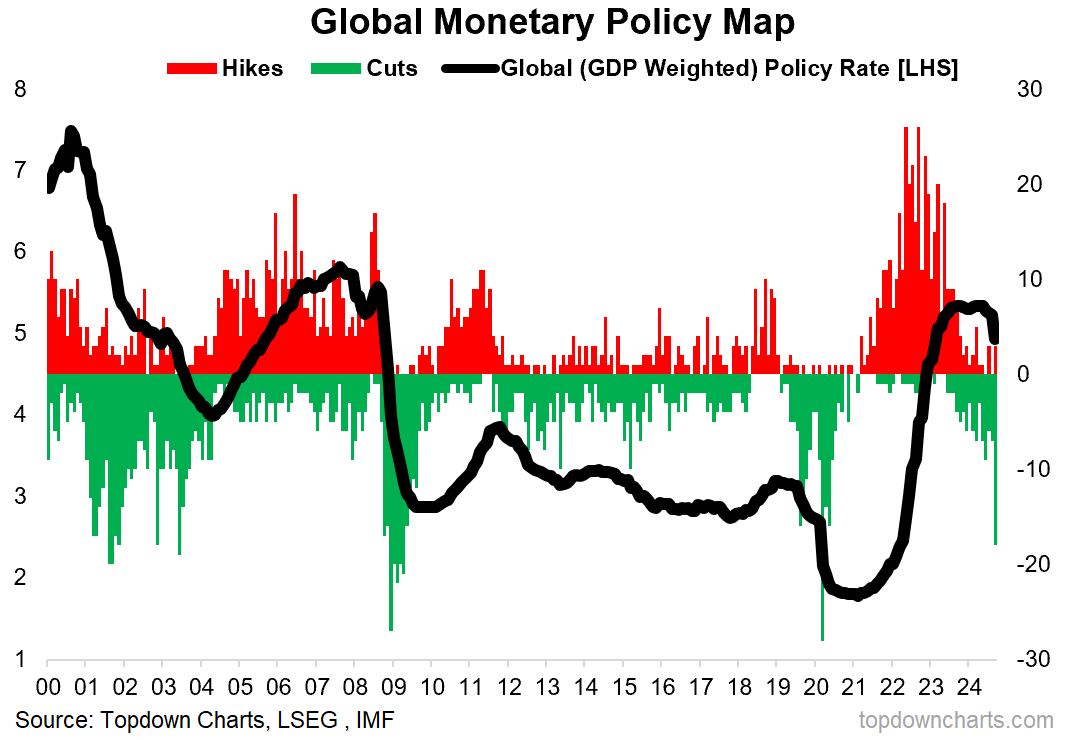
Slowly at first then all of a sudden -- a global scramble to slash interest rates...
First it was panic rate cuts (remember 2020?), then it was panic rate *hikes* as the worst inflation shock since the 1970’s hit …and now? Central banks the world over are hastily pressing the undo button on one of the most substantial, widespread, and rapid tightenings of monetary policy in recent decades.
Indeed, September saw the highest number of rate cuts (and largest drop in global policy rates) outside of the 2008 financial crisis, 2020 pandemic, and early-2000’s recession/bear market.
So what’s really happening with all this, and why now? And most importantly — what are the implications for investors? Let’s take a quick look.
First, the constructive non-sensational take: this is simply an unwinding of previous tightening as the rate of inflation continues to decelerate and ostensibly inflation is no longer an issue …therefore such a tight monetary policy stance is no longer warranted, and it’s just an adjustment and normalization of rates.
But let’s also explore the bear case: globally we have seen a softening of PMIs, clear deterioration in labor market data, and late-cycle signals …in other words, the risk of recession is high and rising and central banks see this —preemptively easing into a potential downturn.
As for the implications there’s a couple of scenarios to consider.
Bullish = Policy Perfection: central banks gently ease rates back to a higher plateau, inflation does not resurge, recession does not happen (soft or no landing), policy perfection is achieved, central banks sail into the sunset. Stocks likely do well in this scenario, and bonds probably do OK but nothing remarkable.
Bearish = Recession: central banks seeing the growing storm clouds on the horizon attempt to preemptively ease, but it’s too little too late given policy leads/lags, and a garden variety recession sets in. Stocks do poorly in a traditional recession as earnings slip and sentiment sours, while bonds shine; this would be the best case for bond bulls as central banks cut rates further into recession and potentially even switch back from QT to QE.
Bullearish = Resurgence: the rate cuts are not needed, and end up triggering reacceleration risk and inflation resurgence. Stocks do well, initially riding the monetary easing tailwinds as earnings hold up and confidence blooms, but then 2022 (/1970’s) echoes see inflation return with a vengeance —sending policy makers scrambling back to rate hikes, bond yields spike (bad for bonds), and stocks tumble from lofty valuations. In other words, bullish at first for stocks and bonds, but then bearish as things unfold to their logical conclusion. Cash and commodities win.
So which one is it?
Too soon to tell. If I had to guess I would say maybe the first one as that’s the way the data is tracking and the way markets are behaving/pricing things. If I look at valuations though bonds are cheap and stocks expensive, so I would say the market is *least* prepared for the recession option. Meanwhile commodities are also cheap… pointing to complacency on resurgence risk. So the opportunities/risks are probably found in the tails here, and consensus is probably in the soft-landing policy-perfection warm porridge. Act accordingly.
Key point: Central banks are apparently scrambling to cut rates.
Portfolio monitoring simplified with reliable AI
Custom reports that integrate structured data—such as performance metrics—with the context for informed analysis. Automatically surface insights from board decks, meeting notes, and company updates. Transparent referencing ensures reliability.
Get comprehensive insights with Spine AI
Topics covered in our latest Weekly Insights Report
Aside from the chart above, we looked at several other charts, and dug into some intriguing global macro & asset allocation issues on our radar:
Market Update: risk-on after rate cuts
Chinese Stocks: clear approval of stimulus announcements
Emerging Markets: technical update, reiterate recommendation/outlook
Ideas Inventory: current live ideas/views/risks for clients
Quarterly Pack: Q4 slide deck and video walkthrough
Subscribe now to get instant access to the report so you can check out the details around these themes, as well as gaining access to the full archive of reports.
For more details on the service *check out this recent post* which highlights:
a. What you Get with the service;
b. the Performance of the service (results of ideas and TAA); and
c. What our Clients say about it.
But if you have any other questions on our services definitely get in touch.
Thanks for your interest. Feedback and thoughts welcome.
Sincerely,
Callum Thomas
Head of Research and Founder at Topdown Charts
Follow me on Twitter
Connect on LinkedIn


