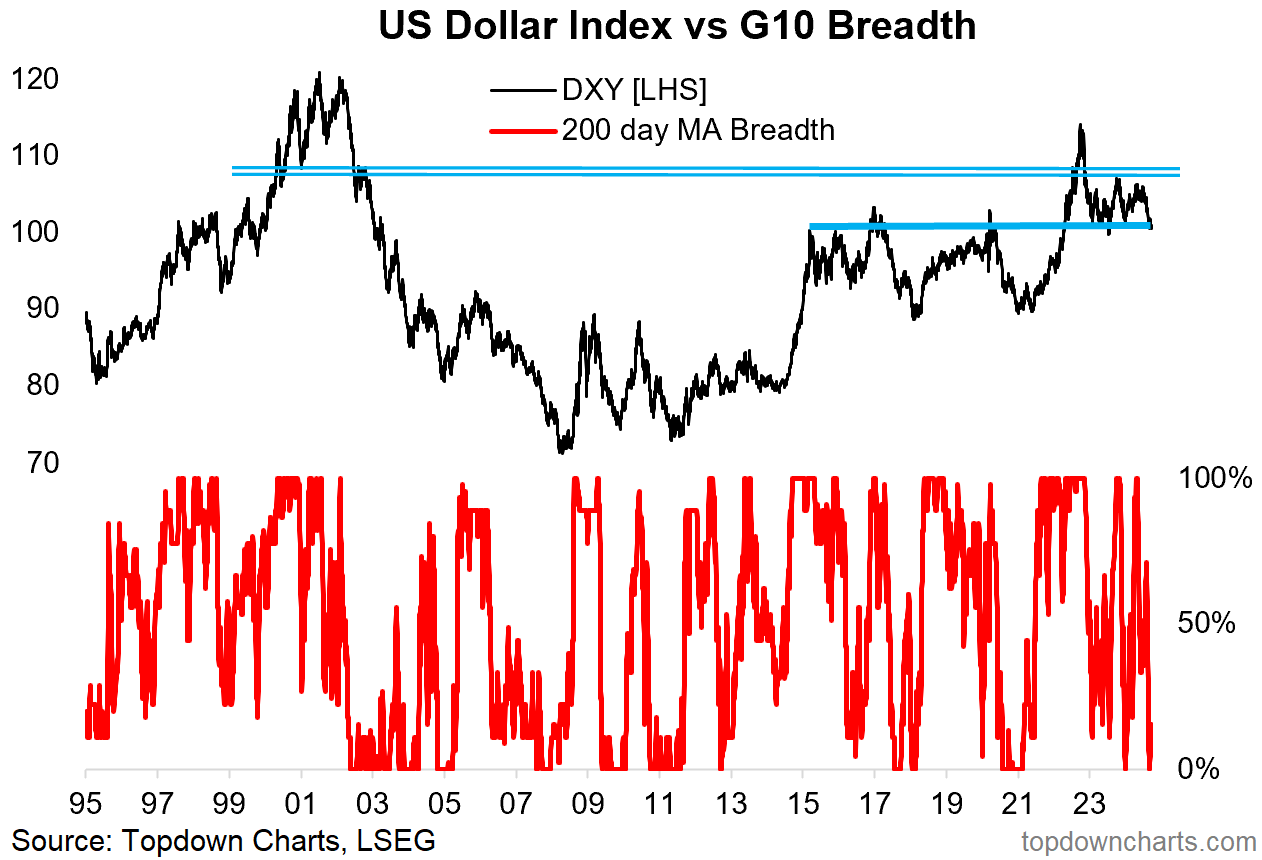
Chart of the Week - Waiting for Dollar
The next phase of the Dollar Bear will bring New Opportunities...
Similar to Crude Oil, the DXY finds itself on the precipice — keeping US Dollar bears and asset allocators alike in suspense. The impending next phase of the US dollar bear market will likely bring easier global financial conditions and tailwinds for global equities...
As a quick bearish technical check-list first: long-term US$ market breadth has collapsed, the DXY has taken out its 200-day average, notched up lower highs (after a failed upside breakout late-2022), and is now attempting to break down through a major longer-term support level.
In my view this is part of a larger and longer topping process as the USD transitions into bear market mode (given that it started from a point of overvaluation, policy divergence, consensus bullishness, and an extended bull run).
The Fed pivoting to rate cuts should be a key part of this picture (more on that below), but it may not be a simple and straightforward path…
Much like crude oil, breaking down is one option, but bouncing is also an option. A rebound in the US dollar could be problematic for risk assets in the short-term through tightening financial conditions (likely also reflecting a potential change in path for the Fed e.g. if inflation resurgence risk reared its head).
But that also serves to highlight the upside from US dollar downside — a weaker dollar boosts returns of foreign assets for US dollar denominated investors (e.g. global equities). That can trigger self-reinforcing flows effects and provide a key tailwind to emerging markets and developed ex-US equities (among others).
In other words, some of the most watched, most anticipated relative (and absolute) value opportunities in global equities may finally be about to receive the catalyst they need for the value case to kick-in.
So definitely a chart to keep an eye on both for the direct opportunities as USD weakness broadens out, and indirect opportunities as a weaker dollar eases global financial conditions.
Key point: The US dollar looks set to enter the next phase of its emerging longer-term cyclical bear market.
Upgrade to paid for more top-down insights + specific ideas for multi-asset investors.
Bonus Chart: here’s an update to a previous Chart Of The Week — US vs developed ex-US policy rates. The key point on this one is that the US has strayed far from the pack, and in the past 3 hiking cycles the Fed was much more aggressive in easing when it pivoted… meaning that if history repeats the US will do most of the heavy lifting on squeezing rate differentials, and hence taking away a previous pillar of support for the US Dollar. So this would be a key macro/fundamental catalyst to more significant USD weakness — which already seems apparent in the technicals.
Topics covered in our latest Weekly Insights Report
Aside from the chart above, we looked at several other charts, and covered the following in our entry-level service here:
Market Update: checking in on markets post-Fed
Commodities: reviewing resurgence risk (and rate cut impacts)
Macro Risk Radar: what’s on the calendar, things to watch
Ideas Inventory: current open/live ideas and themes
Research Agenda: (Quarterly Time!) —See Sample Quarterly Pack
Subscribe now to get instant access to the latest report so you can check out the details around these themes, as well as gaining access to the full archive of reports.
For more details on the service *check out this recent post* which highlights:
a. What you Get with the service;
b. the Performance of the service (results of ideas and TAA); and
c. What our Clients say about it.
But if you have any other questions on our services definitely get in touch.
Thanks for your interest. Feedback and thoughts welcome.
Sincerely,
Callum Thomas
Head of Research and Founder at Topdown Charts
Follow me on Twitter
Connect on LinkedIn


