Chart of the Week - Banking Boom?
A sector long-forgotten is back to boom times with a critical macro signal...
It seems like the prevailing macro mood right now is one of pessimism.
But here’s an interesting datapoint..
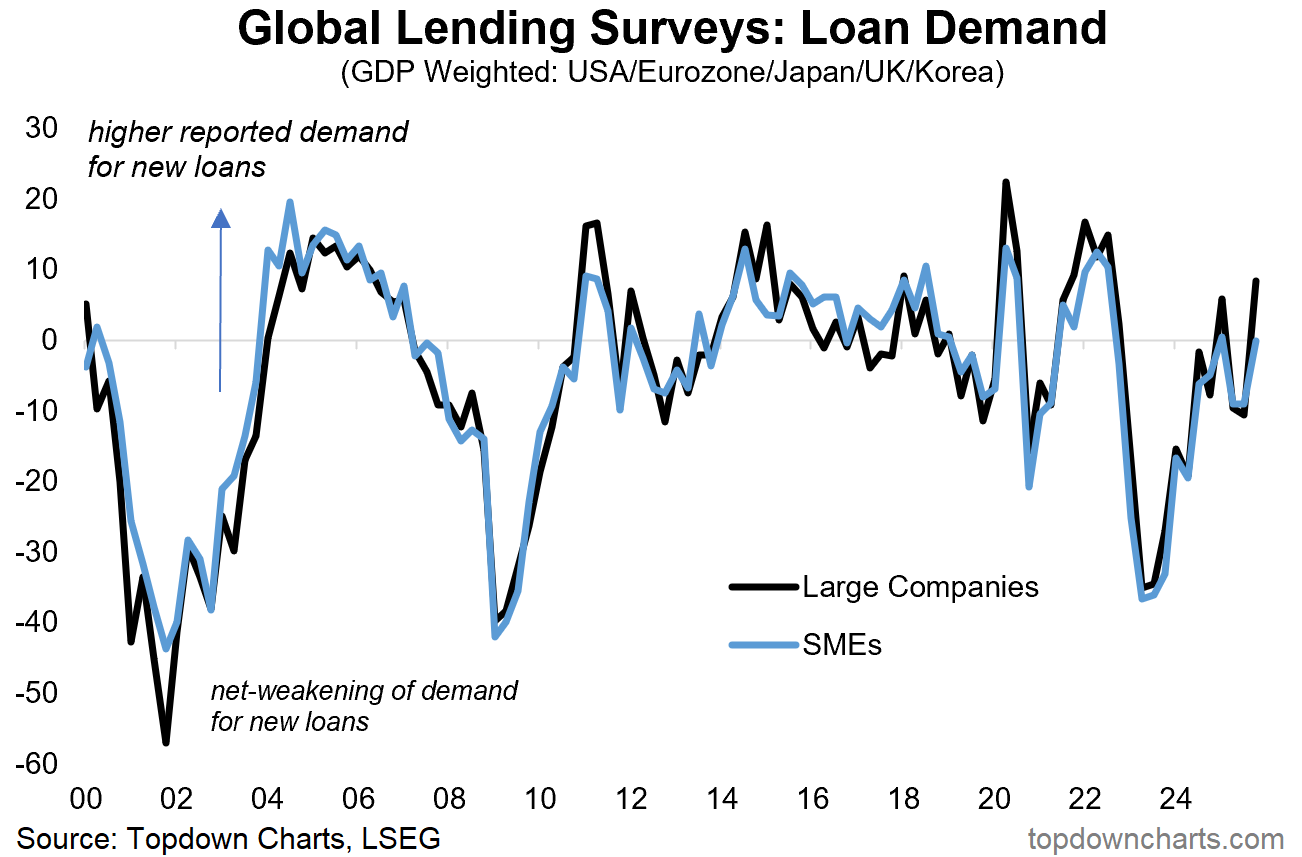
Globally banks are reporting a resurgence in loan demand.
This follows an initial long recovery from the 2022/23 shadow recession and then again rebounding from the tariff-volatility shock earlier this year.
It also lines-up neatly with what I’ve been yabbering on about with the “Global Growth Reacceleration“ theme [as explained in the 2026 Outlook Webinar].
While it is possible to see loan demand increase when firms are facing cash and liquidity pressures (e.g. in early 2020), the much more common driver is increased activity, capacity issues (strong demand), and optimism on the future.
Typically businesses will take out loans to fund long-term expansion-oriented programs e.g. M&A, real estate/premises purchases, investment in plant & equipment, and other growth initiatives.
Not only will they need to prove to the bank their current and anticipated ability to service the loan, but also clearly articulate the anticipated uplift in revenues and cashflow from the investment (and timing thereof).
In other words: it’s a bullish macro sign to see corporate loan demand increasing.
And it’s a contrasting positive sign amongst all the pessimism and negativity that seems to be dominating the discussions lately + definitely interesting as a point of confirmation for a prospective uptick in growth heading into 2026.
Key point: Loan demand is on the rise: a bullish signal for the growth outlook.
Like this post so far? :-) Please consider sharing it (e.g. forward to a friend/colleague, share on social media, + feel welcome to use the charts in your own work)
Bonus Chart 1 — Funding Conditions
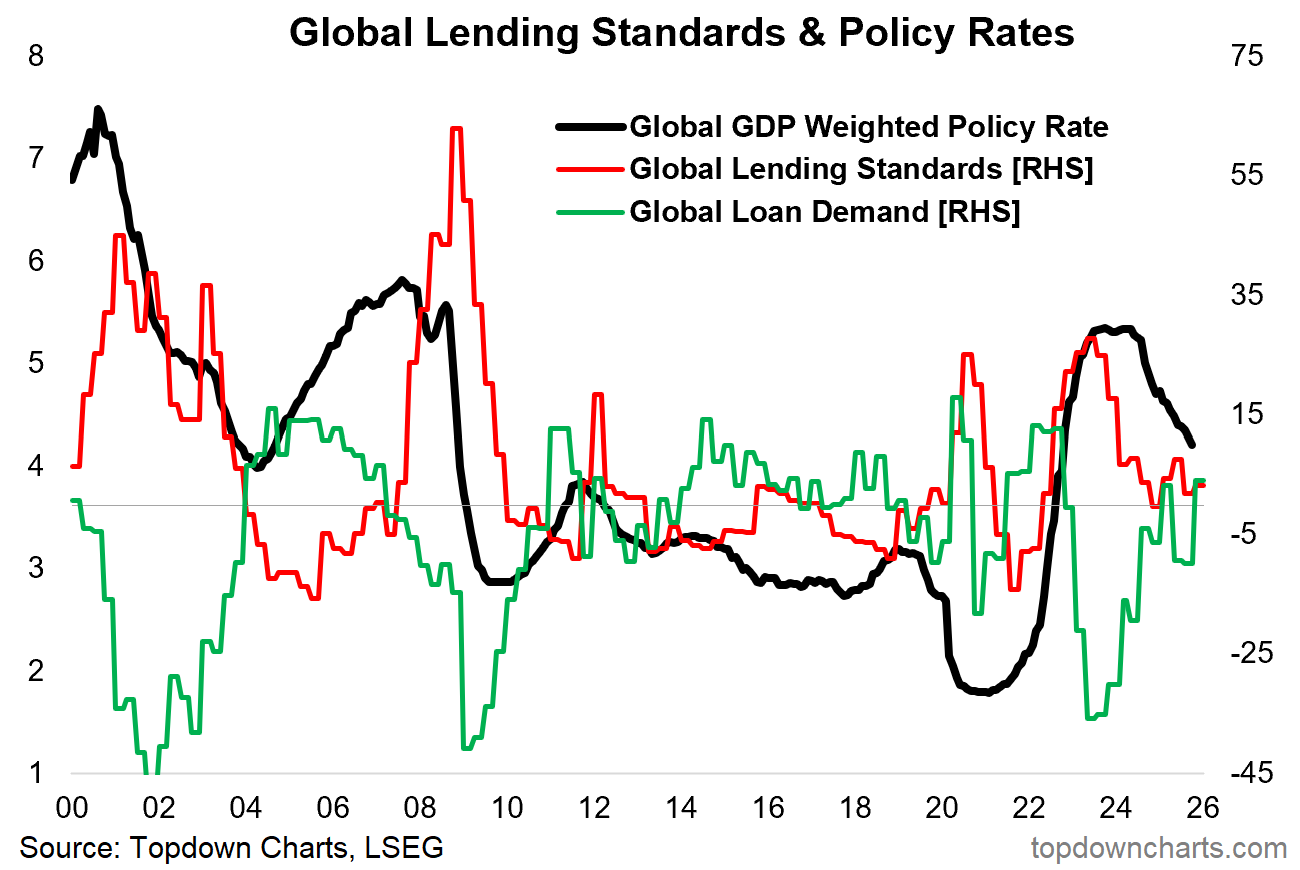
It’s also interesting to track the trends in reported loan demand (chart above) alongside lending standards (whether banks are increasing vs decreasing hurdles and scrutiny for approvals) AND monetary policy rates.
Loan demand typically will fall when economic conditions are poor and uncertainty is high, but also when interest rates are rapidly rising and at levels where the hurdle to return on investment is too high.
But the key takeaway on this second chart is: loan demand is recovering, lending standards are not tightening at any alarming rate, and interest rates are steadily declining — add to that tight credit spreads, and overall its a picture of much improved and generally supportive funding conditions for corporations (good for the growth and investment outlook).
n.b. If you haven’t yet, be sure to subscribe to the [free] Chart Of The Week or better yet: Upgrade to Paid for Premium macro-market Content.
Bonus Chart 2 — Bank Stocks
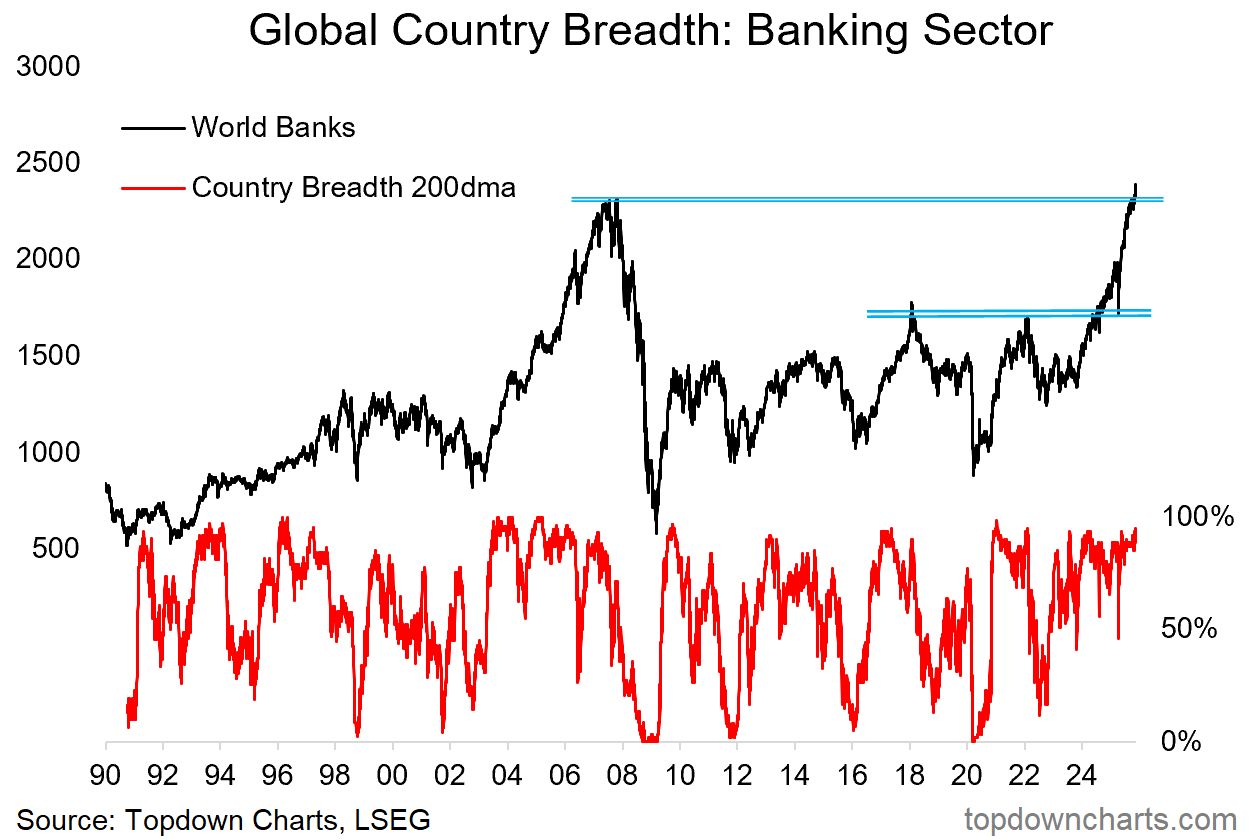
Lastly, it’s also worth pointing out the strength we’ve seen in global bank stocks. Breadth across countries is running at a very strong pace, and after retesting its previous big breakout in April, the global bank stock index has now broken out to new all-time highs.
It’s been a long time coming for banks to finally recover to pre-GFC levels, and as I’ve noted with a few other big breakouts we’ve been seeing this year — it follows a long period of ranging and consolidation (and repair/restructure) so it’s a highly significant development.
Very interesting itself as far as the stocks go, but also interesting as another arguably quite positive macro sign and signal here.
p.s. Not a Paid Subscriber yet?
Be sure to sign up so you can access premium content including exclusive well-rounded ideas spanning risk alerts, investment ideas, and impactful macro insights to help make you a better investor — [ Sign Up Now ]
Topics covered in our latest Weekly Insights Report
Aside from the chart above, we looked at several other intriguing macro-market issues in our latest entry-level service weekly report:
Market Update: commentary as markets move risk-off
Commodity Technicals: update on commodities now and into 2026
Global Lending Standards: trends on bank loan supply/demand
Credit Spreads (and private credit): where are the risks/opportunity
Stocks vs Bonds: when is it time to move overweight bonds vs stocks
Global ex-US Equities: best opportunities are abroad
GSV vs ULG: Global/Small/Value vs US/Large/Growth
Subscribe now to get instant access to the report so you can check out the details around these themes + gain access to the full archive of reports + flow of ideas.
For more details on the service check out the following resources:
Getting Started (how to make the most of your subscription)
Reviews (what paid subscribers say about the service)
About (key features and benefits of the service)
But if you have any other questions definitely get in touch.
What did you think of this note?
(feel free to reply/comment if you had specific feedback or questions)
Thanks for your interest. Feedback and thoughts welcome.
Sincerely,
Callum Thomas
Head of Research and Founder at Topdown Charts
Follow me on Twitter
Connect on LinkedIn
NEW: Services by Topdown Charts
Topdown Charts Professional —[institutional service]
Topdown Charts Entry-Level Service —[entry-level version]
Weekly S&P 500 ChartStorm —[US Equities in focus]
Monthly Gold Market Pack —[Gold charts]
Australian Market Valuation Book —[Aussie markets]


