
Chart of the Week - Inflation Resurgence
You need to become very familiar with inflation resurgence risk very soon...

Something very interesting is happening in the macro world right now.
Central Banks have undertaken a mass-migration from hiking rates to cutting rates.
Normally this type of policy pivot would only be seen as a panic response to recession, crisis, and downturns. And to be fair there are some weak spots out there, but there’s no crisis, no full blown recession, and asset markets are charging higher.
Inflation has come down —there is that; so you can argue that this pivot makes sense from the standpoint of pulling back on previous panic tightening…
But here’s the problem: disinflation is done.
Global median inflation rates have stabilized and some measures of inflation have even begun to turn up again.
And yet the rate cuts continue, with more central banks joining the movement (e.g. Australia + India commencing cuts this month).
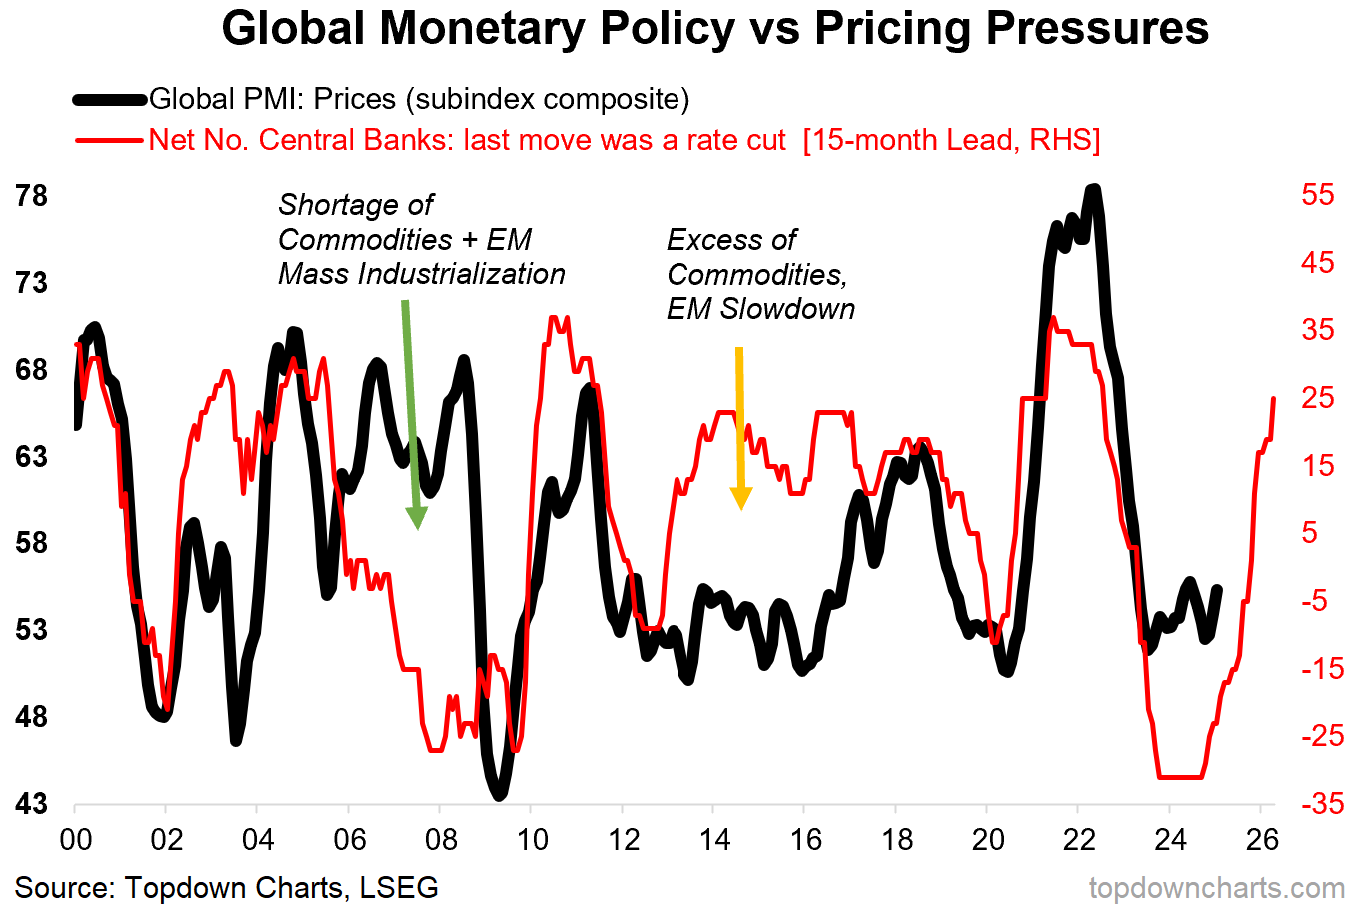
That brings us to the chart below.
The red line shows the net number of central banks globally whose last move was a rate cut.
The recent surge in that indicator just goes to show how resolute the global rush to rate cuts has been.
The problem with that is the black line (pricing pressures).
The red line leads the black line (logic = rate cuts stimulate demand, higher demand tightens capacity and puts upward pressure on prices, inflation rises).
In other words, the core thesis is: stable growth (remember no recession or crisis forcing their hand this time) + global monetary policy easing = global growth reacceleration.
With commodities cheap and a decade of underinvestment in supply by commodity producers, I could not be more bullish on the outlook for commodity prices in this context. That’s a really important point — from a macro standpoint rising commodity prices means upward pressure on inflation…
From an investing and portfolio management standpoint that means a major upside opportunity (for commodities, but not much else; stocks and bonds might actually stumble in this scenario), and at the very least commodities are a logical and obvious hedge to a near and pressing risk.
So keep an eye on inflation resurgence risk and keep in mind commodities as a hedge against this rising risk.
Key point: The global rush to rate cuts mean resurgence risk is rising.
CHART NOTES: n.b. I have added notes to the chart because there was 2 major breakdowns in this relationship; first was the 2000’s emerging markets boom which saw demand for commodities explode against a constrained supply backdrop. The second is in the mid-2010’s where the opposite happened — commodity producers responded to the commodity price supercycle of the previous decade by overinvesting in supply… and then emerging markets hit the growth wall and rate cuts did next-to-nothing to offset that deflationary force.
This post is Free: please help spread the word, e.g. share charts/links on social media, forward this email to your friends/colleagues, re-stack it on Substack notes, link to it in a blog post, feature it in a presentation or report… anything you can do to help is much appreciated :-)
Bonus Chart — Going Platinum
This highly pertinent chart from the latest GoldNuggets Digest report shows what is basically the forgotten precious metal…
With silver surging and gold going for it, platinum’s been patient — stuck in the range, coiling into a triangle formation; waiting for its turn to breakout. And this is where it gets interesting:
“I often describe silver as a combination of precious metal and industrial metal, and platinum is the same… but the weighting to industrial metal is even higher. So we probably need to see global growth sentiment heat up a bit more for this one to breakout (which also makes it less of a defensive asset, more of a cyclical).“
This is pretty much exactly what I’ve outlined above, the odds of an inflation resurgence are steadily rising, and commodities are going to be a key beneficiary of that. So from an asset allocation standpoint commodities are as much a lever to boost returns as they are a hedge against the dark side of inflation resurgence (rates and bond yields may undertake a sharp rise, stocks encounter turbulence as a result).
Practically speaking, a breakout to the upside of the triangle formation in the chart below will essentially confirm growth reacceleration + inflation resurgence, while a break-down will be a waving flag for recession risk.

Be sure to head over to Monthly Gold Market Chartbook to subscribe to the [free] GoldNuggets Digest (regular charts on gold, precious metals, miners, and macro)
Topics covered in our latest Weekly Insights Report
Aside from the chart above, we looked at several other charts, and dug into some intriguing global macro & asset allocation issues on our radar:
US Dollar Outlook: weighing the short-term vs bigger picture outlook
Resurgence Risk: global growth is set to reaccelerate, inflation is back
Commodities: high conviction cyclical view (multiple factors)
Credit Spreads: reviewing the key charts and indicators on credit
Global Banks: things are looking up for the banking sector
Japan: reviewing valuations, positioning, macro
Subscribe now to get instant access to the report so you can check out the details around these themes, as well as gaining access to the full archive of reports.
For more details on the service *check out this recent post* which highlights:
a. What you Get with the service;
b. the Performance of the service (results of ideas and TAA); and
c. What our Clients say about it.
But if you have any other questions on our services definitely get in touch.
Thanks for your interest. Feedback and thoughts welcome.
Sincerely,
Callum Thomas
Head of Research and Founder at Topdown Charts
Follow me on Twitter
Connect on LinkedIn
NEW: Services by Topdown Charts
Weekly S&P 500 ChartStorm —[US Equities in focus]
Monthly Gold Market Pack —[Gold charts]
Topdown Charts Professional —[institutional service]
Australian Market Valuation Book —[Aussie markets]